There are two main types of approaches for multiomics integration
Knowledge - driven integration: this type of integration is based on prior knowledge to link key features in different omics.
For instance, the KEGG metabolic network is often used to connect key genes, proteins or metabolites obtained from different omics layers
to help identify the "activated biological processes". This type of analysis can be expanded to include other molecular interaction networks
such as protein-protein interactions, TF-gene-miRNA interactions etc. We have developed
OmicsNet and miRNet to support
multi-omics integration based on comprehensive, high-quality molecular networks.
The knowledge-based integration is mainly limited to model organisms where comprehensive knowledgebase exists.
In addition, it is biased to existing knowledge with limited capacity for discovering novel relationships. This is where the data & model driven
integration aims to address.
Data & model – driven integration: this type of integration applies various statistical models or machine learning algorithms to detect
key features and patterns that co-vary across omics layers. In general, this type of integration is not confined to existing knowledge and is more
suitable for novel discoveries.
A key limitation of this type of integration is that there are no consensus approaches and a wide variety of methods have been developed over
the past decade. Each method carries its own model assumption (or bias) and pitfalls. Properly using different methods and interpreting their results
become the main challenges to researchers in the field. This is one of the main motivations driving the development of OmicsAnalyst.
OmicsAnalyst has been developed as a general purpose platform to support common tasks in Data & model – driven integration of multi-omics data.
In particular, it helps answer these common questions:
What are the key features that are closely correlated within and across omics layers (correlation analysis)?
Which samples share similar coordinated patterns of change across omics layers (clustering analysis)?
What are the main shared the co-variance of the data, and the key features underlying the co-variance (dimension reduction or projection analysis)?
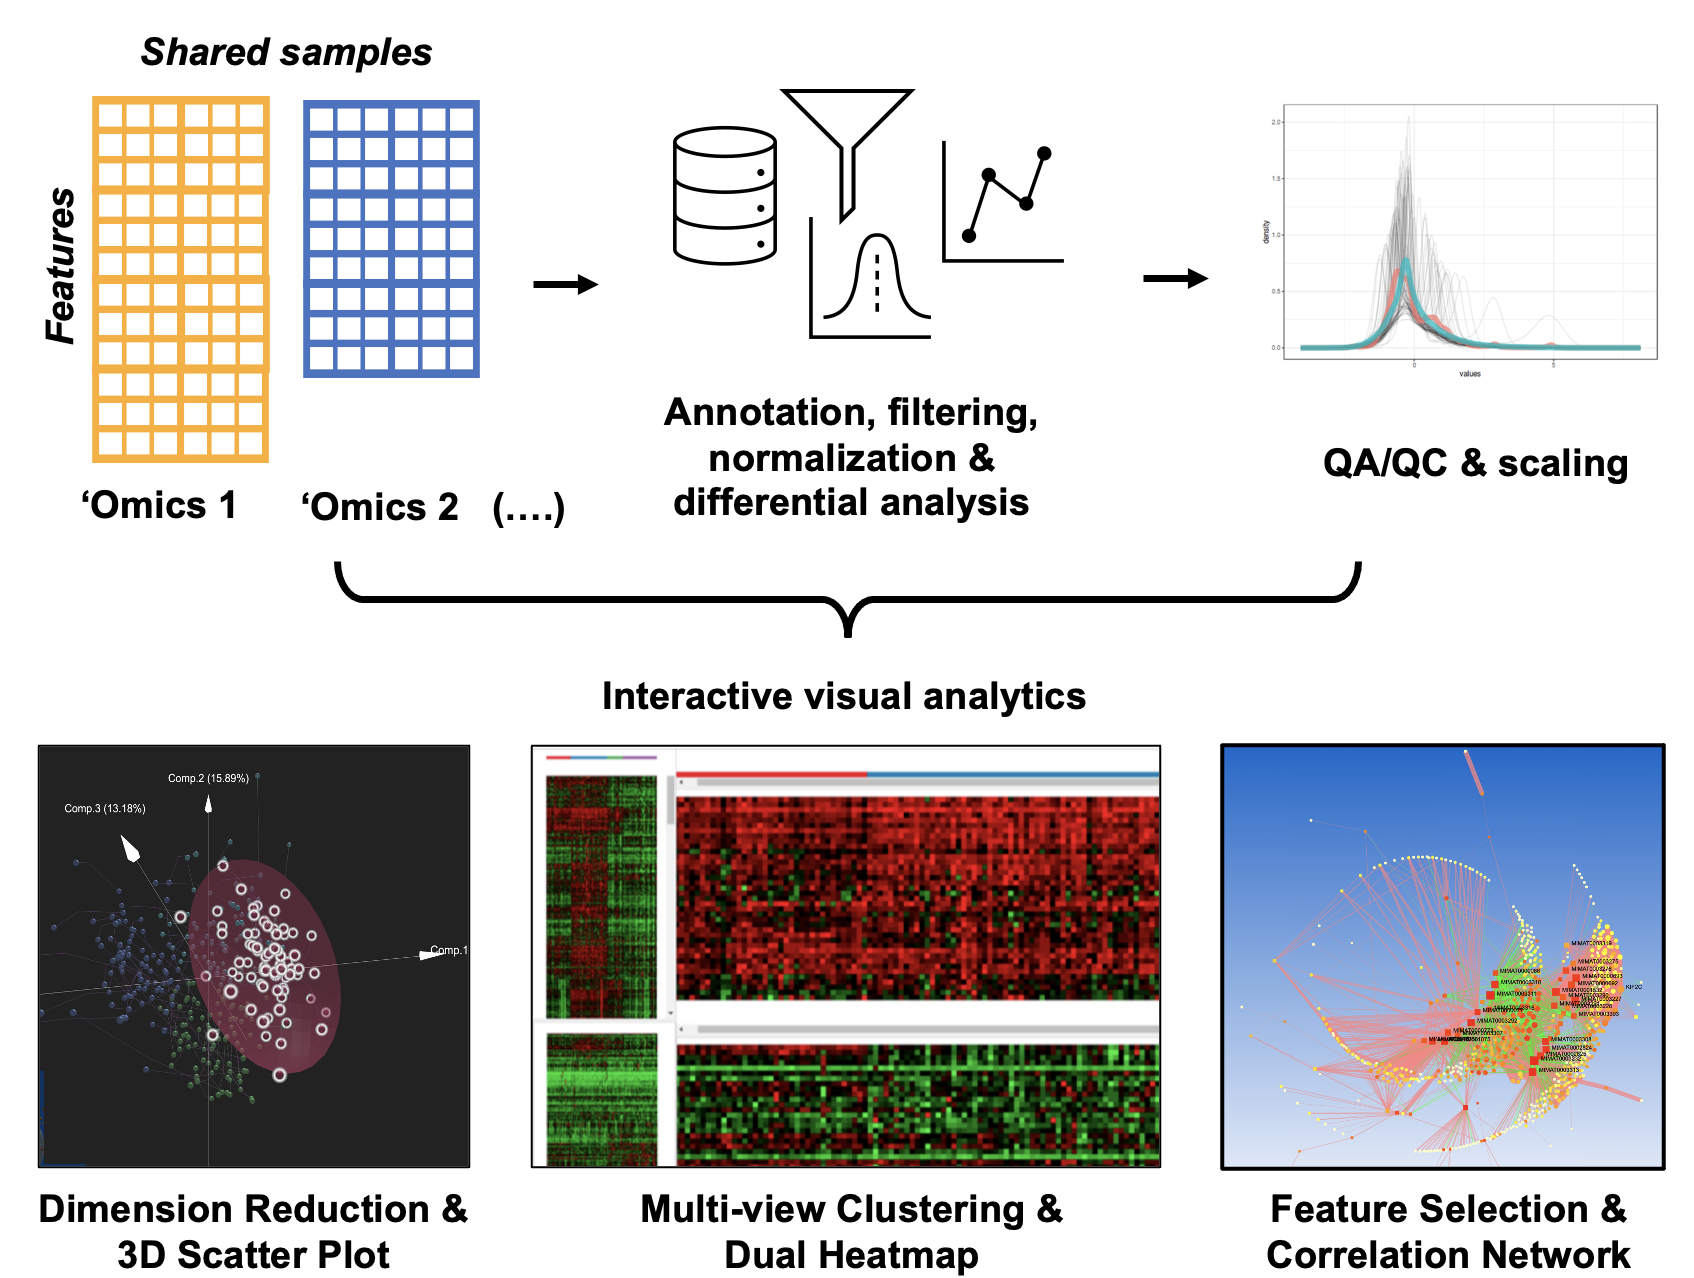
OmicsAnalyst was designed to provide an intuitive means for clinicians and bench scientists to work directly with big omics data.
It achieves this by integrating multivaritate statistics, density-based clustering, and 3D visual analytics in a user-friendly web-based platform
to allow users to interact and discover patterns within their large datasets from their personal computer. It offers data processing and QA/QC prior to
three main visual analytics systems:
Interactive scatter plot displaying simultaneously feature and sample space in 3D space.
Dual-heatmap viewer to visually compare expression patterns of two omics datasets.
2D/3D network viewer to visualize correlations and associations between features.
All of our visual analytics systems are coupled with extensive clustering analysis and flexible differential analysis.
OmicsAnalyst has annotation files for human and mouse data, however data from any species can be processed and analyzed by leaving the
"Specify Organism" drop-down menu as "---- Not Specified ----". All tools in OmicsAnalyst will work except for the targeted enrichment
analysis, since this requires IDs to match to the pathway libraries. Since enrichment analysis is typically the final step in an
analysis pipeline, the lack of annotation should not have a large impact.
OmicsAnalyst is very flexible and can be used to answer many different questions in omics and multi-omics data analysis.
Below are some common questions that OmicsAnalyst can address.
Explore inherent trends and patterns in multi-omics data and whether samples cluster according to biological condition
-Heatmap viewer
…and identify correlated features between two datasets.
-Correlation network using DIABLO, univariate and partial correlation.
…and identify potential biomarker features
-DIABLO, MCIA, differential analysis
Identify clusters from dimensionally reduced sample space and/or expression heatmap
The 3D visualization system was developed based on the Web Graphics Library or WebGL technology.
WebGL is the standard 3D graphics API for the web. It allows developers to harness the full power of the computer’s 3D rendering hardware
from within the browser using JavaScript. Before WebGL, developers had to rely on plugins or native applications and ask their users to
download and install custom software in order to deliver a hardware-accelerated 3D experience.
WebGL is supported by most major modern browsers that support HTML5. We have tested OmicsNet in several major browsers (see below).
Our empirical testings have shown that Google Chrome usually gives the best performance for the same computer:
In the System section, ensure the Use hardware acceleration when available
checkbox is checked (you'll need to relaunch Chrome for any changes to take effect)
Then enable WebGL:
Type chrome://flags in the browser and press Enter
Ensure that Disable WebGL is not activated
(you will need to relaunch Chrome for any changes to take effect)
Here you will have to change Default to Enabled in the drop down.
Type about:config in the browser address bar and press enter
Search for webgl.disabled
Ensure that its value is false (any changes take effect immediately without relaunching Firefox)
Then inspect the status of WebGL:
Go to about:support
Inspect the WebGL Renderer row in the Graphics table:
If your graphics card/drivers are blacklisted, you can override the blacklist.
Warning: this is not recommended! (see blacklists note below). To override the blacklist:
The visualization is limited by the performance of users' computers and screen resolutions.
Too many data points will result in greater latency in manipulating the plot.
Based on empirical tests and practical utilities, we recommend to keep the total data points
to be less than 5000 - it is rare that the sample size will be larger than this number.
For very large data, please make sure you have a decent computer equipped with a high performing graphics card.
Yes. The data files you upload for analysis as well as any analysis results, are not downloaded or examined in any way by
the administrators, unless required for system maintenance and troubleshooting. All files will be deleted automatically after
72 hours, and no archives or backups are kept. You are advised to download your results immediately after performing an analysis.
OmicsAnalyst accepts two or more feature abundance tables generated from common omics technologies such as
transcriptomics, proteomics, metabolomics, and miRNA data. Features must be in rows and samples in columns (example below).
Files must either be in .txt, .csv, or their compressed format (.zip).
A metadata file (upload together with the above feature abundance file)
                                    #NAME          Condition   Gender
                                    sample10       Classical    M
                                    sample105      Classical    M
                                    sample11       Classical    F
                                    sample113      Classical    M
                                    ......
Notes about formatting your data files:
Sample and feature names must be unique and consist of a combination of common English letters, underscores and numbers for naming purpose. Latin/Greek letters are not supported.
Sample names must be consistent across all files (i.e. omics abundance tables and metadata file).
Data values should contain only numeric values. Empty cells or cells with NA values are considered missing values.
If you include metadata in the feature abundance file, metadata or group label should directly below sample names indicated by "#CLASS". You can indicated multiple factors.
For instance, the above TCGA example data sets contains two factors indicated by "#CLASS:Condition", "#CLASS:Hours", respectively.
OmicsAnalyst accepts a maximum of five data sets for upload in any one analysis. Data sets are always available along the left-hand side
and the selected data can be changed until the visual analytics step. Every method in OmicsAnalyst works with two data sets, and a few
work with more. One issue is that even though the multi-variate statistics may work for more than two data sets, the visualization
quickly becomes so complicated that it is not useful. For this reason, we have disabled greater than two data sets for the heatmap and
correlation network even when the statistics allow it. Up to five data sets are allowed for the 3D scatterplot for the MCIA
and DIABLO methods.
Low variance filter: features whose values do not change across different samples, and thus have very
low variance. Features are ranked by their variance from low to high, and you can exclude a certain percentile of features
with the lowest variance by adjusting the "Variance filter" slider. The above referenced study has suggested that up to
50% genes can be removed based on their variance with improved results
Low abundance filter: features with very low abundance are not measured reliably and may not be biologically important.
You can exclude features below a certain threshold (Absolute option) or exclude a certain percentile (Relative option) by adjusting
the "Low abundance" slider. The above referenced study has suggested 10% genes can be removed based on their abundance with improved results
This step aims to identify statistically significant features for the current omics data. The statistical comparisons perform univariate statistics to
identify features with statistically significant differences across experimental groups. These features are used in some of the downstream visual analytics,
for example the correlation network is constructed from those signficant features. In addition, those features can also serve as baseline to
guide visual exploration using heatmap and 3D scatterplots.
It is possible to include multiple classes that describe the samples (for example, sex and age). OmicsAnalyst restricts statistical
comparisons to only consider one experimental factor, thus users must choose the meta-data labels that they wish to perform statistical
comparisons on.
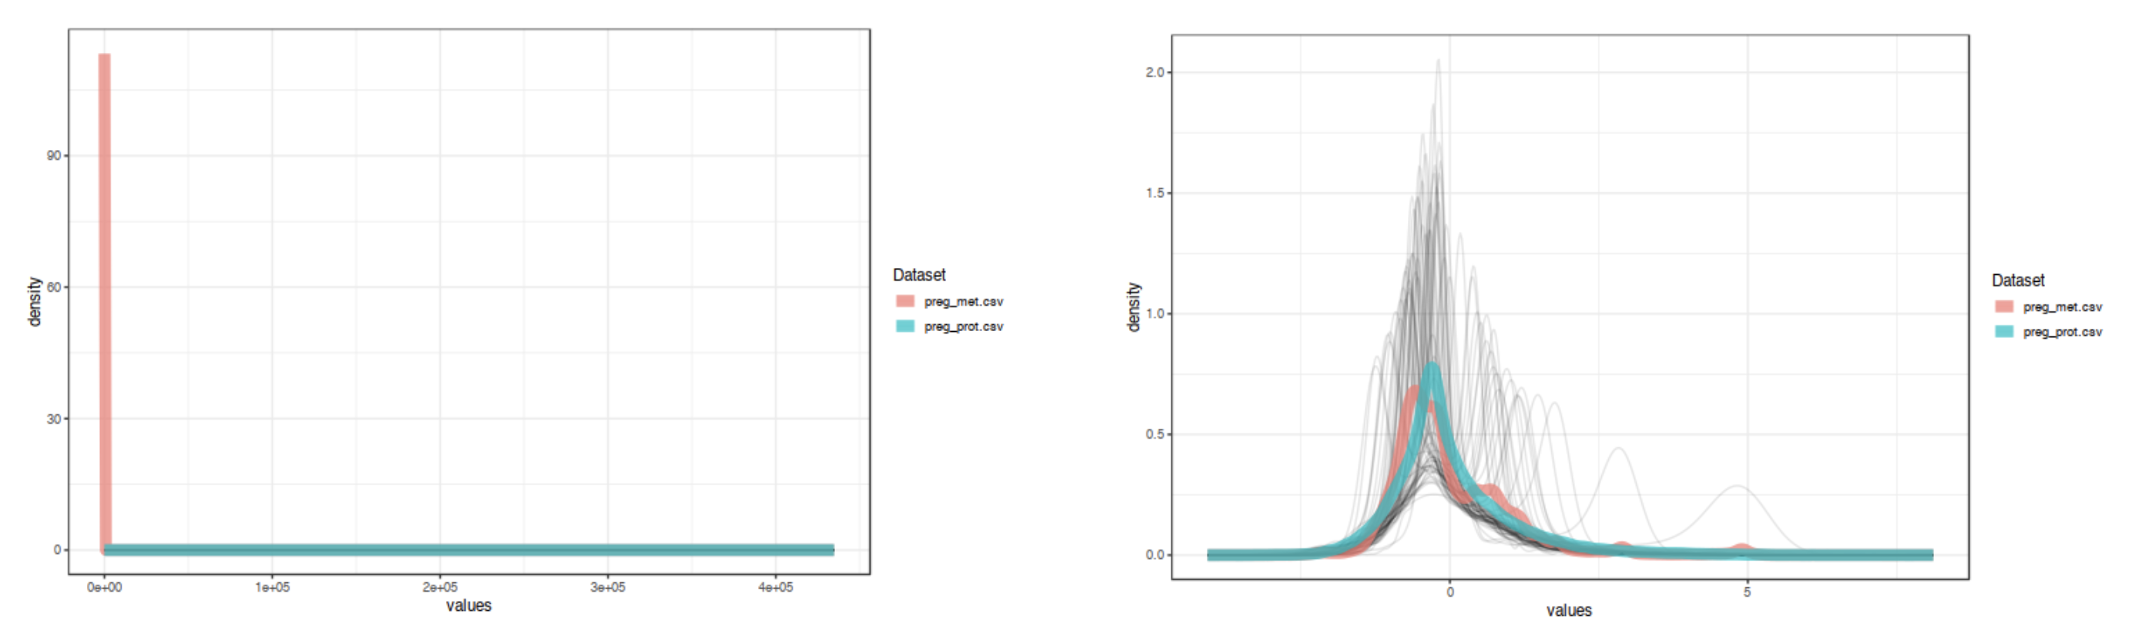
The "Data Quality Check" page provides density and PCA plots of the uploaded 'omics data sets. The density plot allows you to
compare overall distributions between 'omics types while the PCA plots highlight whether there is separation between experimental
groups within each of the 'omics data. This page gives a chance to ensure that the data are comparable to each other prior to
proceeding to more complicated multi-variate statistics. If they data look like they need further normalization, transformation,
or scaling, go back to the data upload page to update. This step is important for proper integration. For example, the image below
shows distributions of example data 1 (proteomics and metabolomics) before and after scaling. The data are much more comparable after
scaling.
Sample normalization refers to the method by which duplicated feature IDs are dealt with. Normalization by sum is more appropriate
for discrete data, for example raw RNA-seq reads counts, while normalization by median is more appropriate for continuous data, for
example MS-based data like metabolomics or proteomics.
Transformation generally means converting the data to a log2-scale, while also accounting for systematic differences between samples.
Some of the methods were originally developed for RNA-seq counts data, and the cross-sample normalization was included to account for differences
in sequencing depth. However, the same methods can be used to account for sample-to-sample differences in other 'omics data.
Scaling is applied to the feature-dimension and refers to standardizing the data such that each feature has roughly the same
distribution. This tends to better highlight differences across samples. It is an important step for multi-omics data since data measured
on different platforms can have vastly different values. Scaling the data can make the 'omics types more comparable to each other,
making it easier to identify consistent patterns across multiple data sets.
Transformations can be applied on both the "Data Processing" page (prior to differential analysis), and on the
"Quality Checking" page (prior to multi-omics integration and visual analytics), and the available options
depend on whether the data are RNA-seq reads or continuous values. Continuous values could be MS-based data, for
example proteomics, or RNA-seq data that was normalized prior to upload. In particular, transformations are disabled
prior to differential analysis if the data are RNA-seq reads, since the algorithms for these data are designed for
raw counts.
The objective of this analysis is to understand relationships between key features across multiple
'omics datasets. This is achieved in two main steps. First, we select key features to define the network nodes.
There are two main ways to do this: either we select features that vary significantly across experimental groups using
the contrast statistics that were computed at the data upload step, or we perform multi-variate dimension reduction
to find sets of features that are both highly connected within individual 'omics datasets and highly associated across
'omics datasets. For the dimension reduction methods, the top 20 features from each of top 3 components and 'omics data are selected
based on the loading scores. Next, we compute the pairwise similarity of selected features to construct the network.
Networks that contain too many nodes and edges are overwhelming, and difficult to use to draw clear biological conclusions. Thus,
the feature selection step aims to consider only the most interesting features, and then to construct a network to understand the
relationships between them. There are two ways of doing this: univariate differential analysis and multi-variate dimension reduction.
The number of statistically significant features is determined by the method and thresholds set during the data processing step.
The results are displayed in the data set summary visible on the left-most panel. Clicking the icon beside the summary allows you
to change the thresholds to either increase or decrease the number of DEGs. This can be done at any point up to the visual analytics
step.
The dimension reduction algorithms find sets of multi-dimensional components that explain the maximum variance within
individual 'omics data sets, and that are maximally related across 'omics data sets. Looking at the loading scores for each component
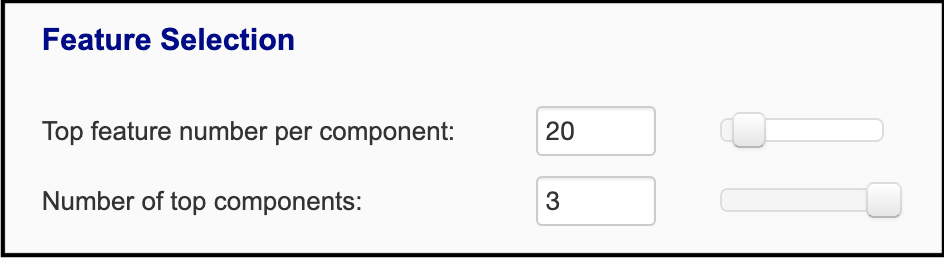
reveals the features that contribute most towards these components. You can adjust how many features are selected:
The first slider specifies the number of top features of each 'omics type that are taken from each component, based on the
ranked abs(loading scores). The second slider specifies the number of top components that features are selected from. Thus,
in this case, twenty features from each 'omics are selected from the top three components: 20 features * 2 'omics types *
3 components = 120 features used for network construction.
A similarity matrix has the same elements along the rows and columns, and each matrix entry contains a measurement of similarity between the
two elements. This makes the matrix both square and symmetric, and the diagonal values all equal to 1.
In OmicsAnalyst, the similarity measurement options are all different types of correlation. For the correlation network, the
similarity matrix gives the similarity between all pairwise combinations of 'omics features across both data sets.
All the correlation types are a standardized measure (between -1 and 1) of the strength and direction of the relationship between two variables.
The three types differ in the type of relationship that they measure. Pearson, the most commonly used correlation, measures linear relationships
between variables, and thus assumes that each variable is normally distributed. Spearman measures monotonic relationships. It is rank-based,
and therefore does not assume normality or linearity and can do a better job at representing non-linear relationships than Pearson correlation.
Kendall correlation is the more general than Pearson and Spearman correlation in that it does not assume normality, linearity, or monotonicity.
It tends to perform better than Spearman if the sample size is small.
Partial correlation simply means computing the correlation between two variables while controlling for, or holding equal,
all other variables. Partial correlation can be better at detecting associations that represent true dependency, rather
than spurious connections that arise from the multicollinearity typically present in 'omics datasets. In our experience,
partial correlation tends to create a sparse network, with many fewer connections between nodes. This can be helpful in
combating the "hairball effect" because it retains more nodes without an overwhelming number of edges. See the image below for an example:
(more details ....)
The correlations between 'omics features of the same type is usually categorically higher than correlations between 'omics features
of different types, likely due to systematic differences in platforms and methods used to collect the data. Because of this,
using a single threshold to prioritize which edges to display will result in the vast majority of edges being between features of
the same 'omics type. OmicsAnalyst has two thresholds to allow users to relax the threshold for inter-omics connections to create
more balanced networks.
The degree and betweenness filters allow you to reduce the size of the network based on its connectivity alone (see later
FAQ for explanations of "degree" and "betweenness"). The key takeaway is that the degree filter tends to retain
hub genes (genes with many connections to other genes), and the betweenness filter tends to retain genes that connect
dense clusters of genes.
The node size is always based on the degree, with nodes of a higher degree being larger.
The colour scheme can be either 'omics type (different types given different colours), expression
(colour based on -log10(p-value)) or plain (all nodes and edges grey).
By default, the edges are coloured based on the correlation sign, with positive correlations in red and negative correlations in green.
The thickness is determined by the absolute value of the correlation, with thicker edges indicating stronger relationships.
A basic assumption is that changes in nodes that occupy key positions within a network will have a greater impact on
the overall network structure than changes in relatively isolated positions. In graph theory,
measures of centrality are used to identify the most important nodes. OmicsAnalyst provides two well-established
node centrality measures - degree and betweenness. The degree of a node is the number of connections
it has to other nodes. Nodes with a high degree act as hubs within the network. The betweenness of a node is the
number of paths that pass through it when considering the pairwise shortest paths between all nodes in the network.
A node that occurs between two dense clusters will have a high betweenness, even if it has a low degree. Note, you
can sort the node table based on either degree or betweenness values by double clicking the corresponding
column header.
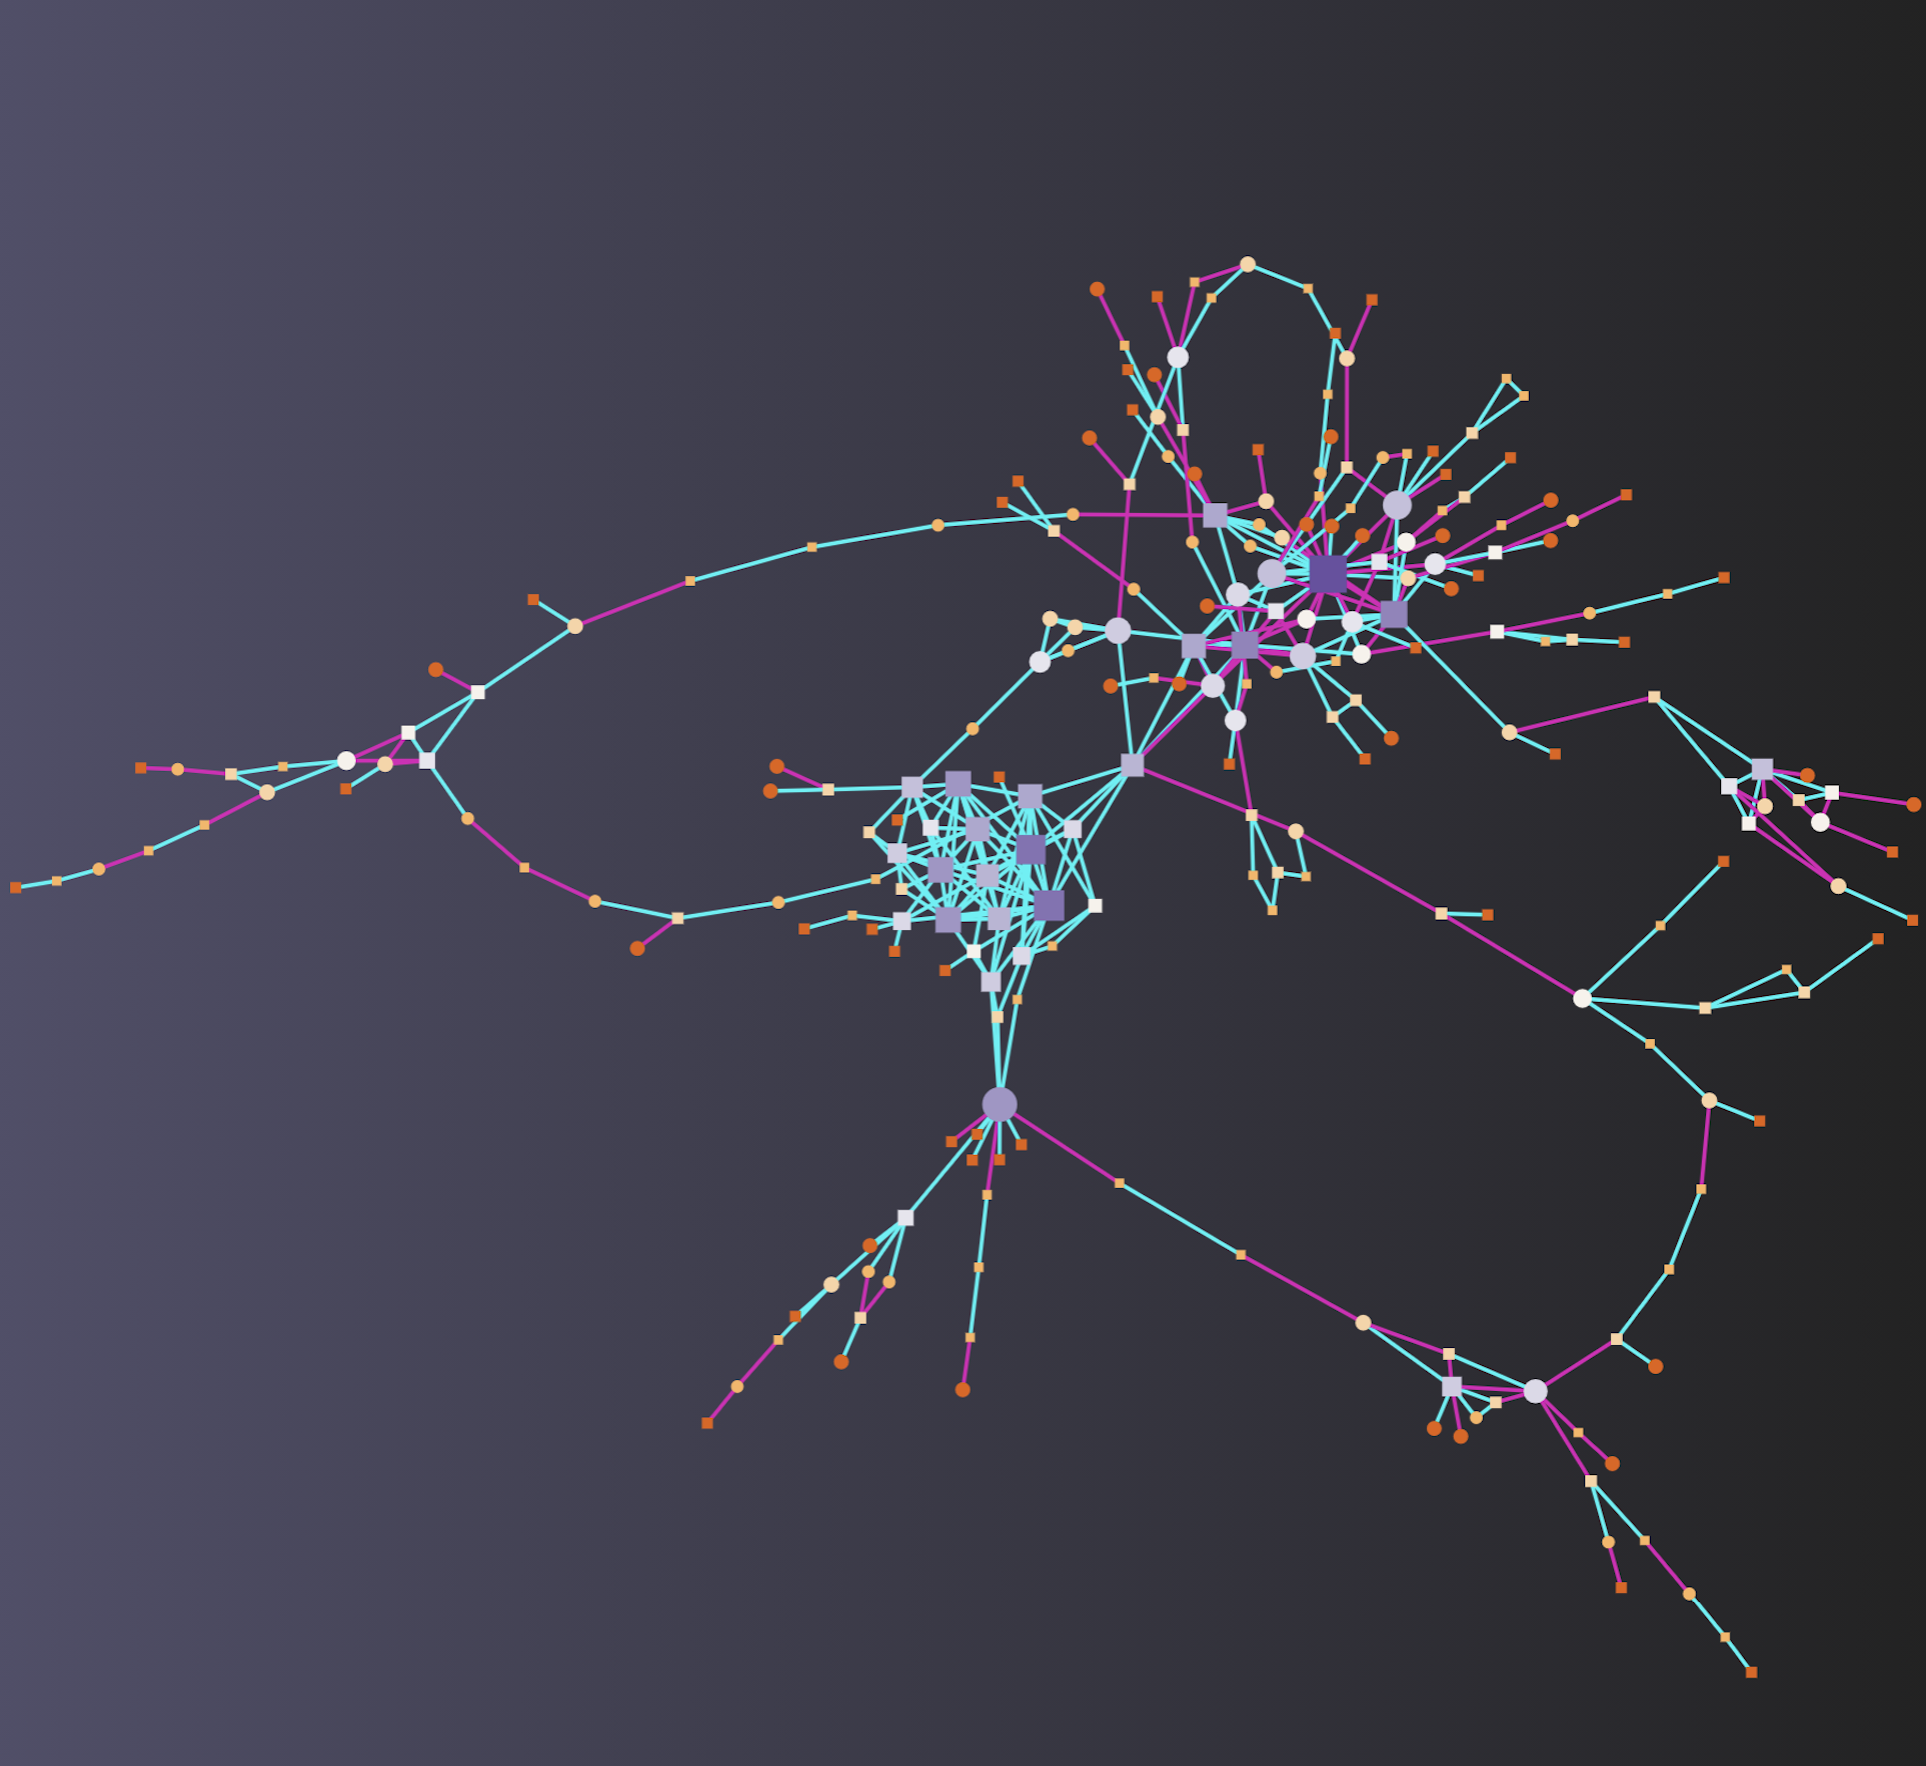
Modules are tightly clustered subnetworks with more internal connections than expected randomly
in the whole network. They are considered as to be relatively independent components
in a graph. Members within a module are likely to work collectively to perform a biological function.
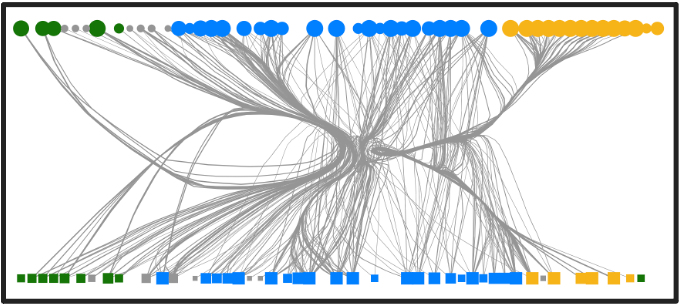
The biological functions of a module can be explored using enrichment analysis. The image below gives an example
of detected modules highlighted within a network:
OmicsAnalyst currently offers three different approaches for module detection - the WalkTrap, InfoMap, and Label Propagation
algorithms. The general idea behind the Walktrap Algorithm is that if you perform random walks on a
graph, a higher number of walks are more likely to stay within a group of nodes that are highly connected to each other
because there are only a few edges that lead outside of them. The Walktrap algorithm runs many short random walks and
uses the results to detect small modules, and then merge separate smaller modules in a bottom-up manner. The InfoMap
Algorithm is also based on random walks, which it uses to minimize the hierarchical map equation for different partitions
of the network into modules. The Label Propagation Algorithm works by randomly assigning a unique label to every node.
On each iteration, node labels are updated to match the one that the maximum of its neighbours has. The algorithm converges when
each node has the same label as the majority of its neighbours.
NetworkAnalyst also integrates the gene expression values as edge weights during module searches. Weights are
calculated as the square of the mean absolute log fold changes of the two adjacent nodes. Larger weights mean
closer connections during random walks.
The p-value of a module is based solely on network connectivity, and gives some indication of how
significant the connections within a defined module are. Let's call the edges within a module "internal"
and the edges connecting the nodes of a module with the rest of the graph "external". The null hypothesis
of the test is that there is no difference between the number of "internal" and "external" connections to
a given node in the module. The p-value of a given module is calculated using a Wilcoxon rank-sum test of
the "internal" and "external" degrees. Users should also consider whether the modules are 'active' under the
experimental conditions, by taking into account the number of seed proteins, their average fold changes,
as well as the enriched functions displayed in the Module Explorer table.
The objective of this analysis is to understand relationships among samples, features and clusters across multiple 'omics datasets.
First, cluster analysis is performed on the samples using methods that integrate information from all 'omics datasets.
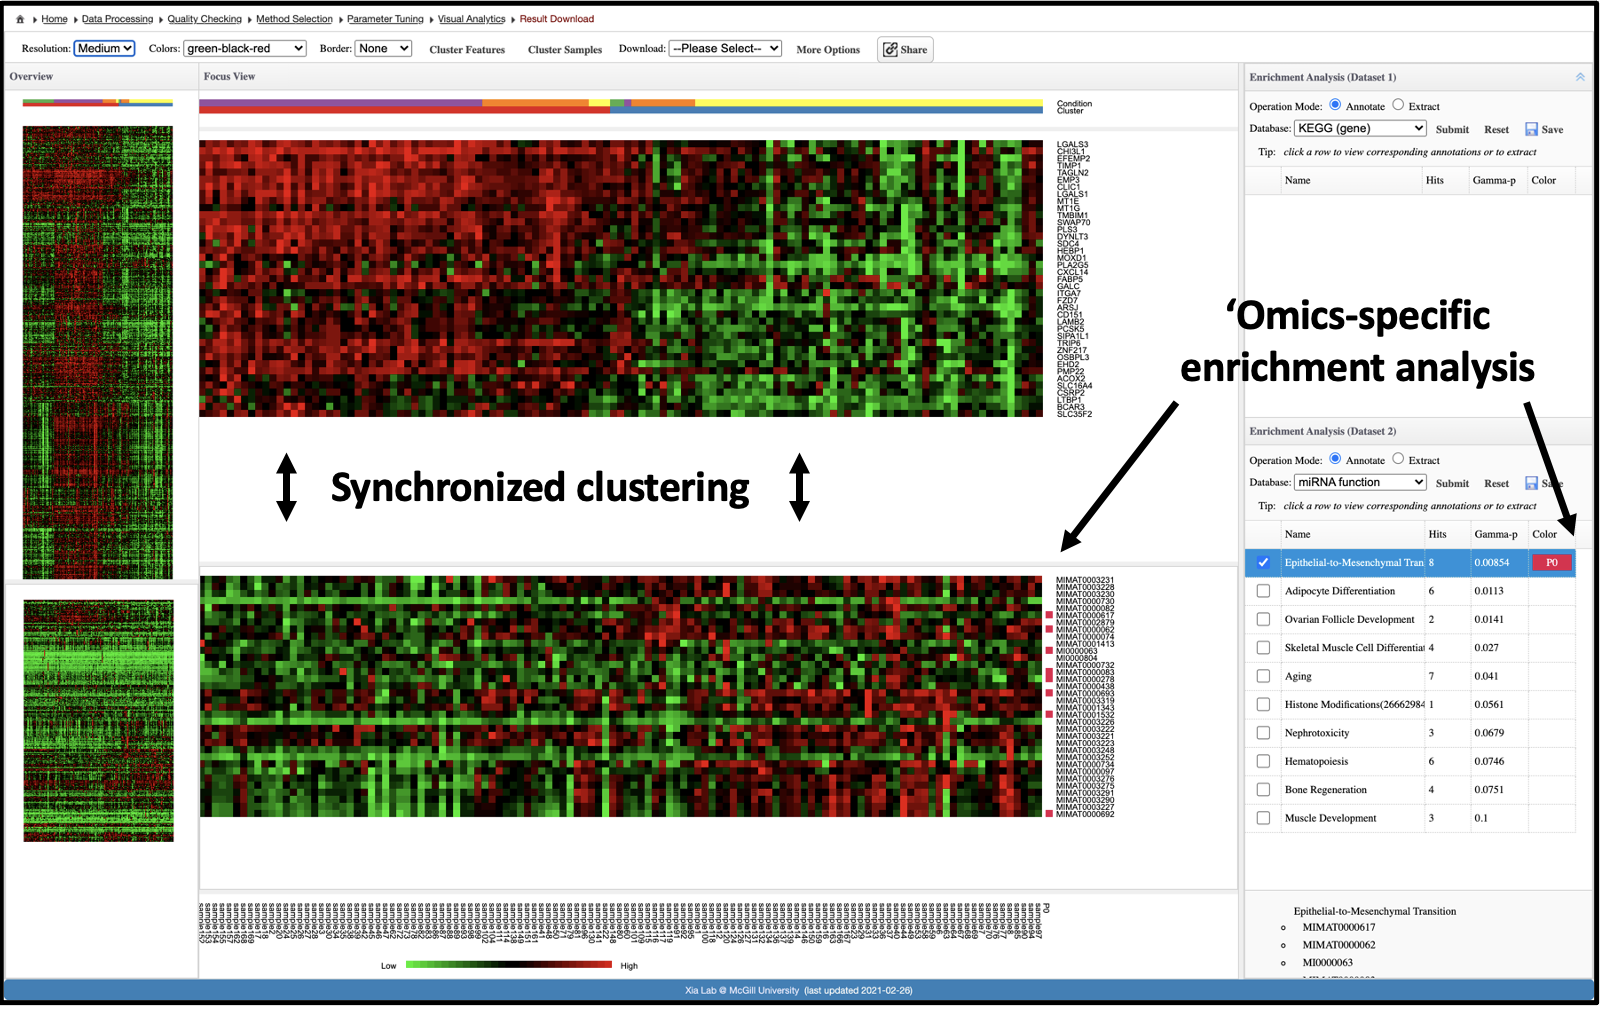
Next, interactive heatmaps (one for each dataset) are placed side-by-side to allow visual identification and subsequent enrichment analysis
of features that correspond to either the detected clusters or the experimental groups.
In addition, standard hierarchical clustering methods can be applied to both the features and samples, making this the most
flexible of the three visual analytics tools in OmicsAnalyst.
If you are not familiar with heatmap, this should be your first choice. This interactive heatmap visual analytics allows you to explore an omics data of
interest within the context of the 2nd omics data or juxtopose two omics datasets simultaneously. It is based on the traditional hierarchical clustering
(Ward, average, single-linkage, complete linkage) for sample clustering and feature clustering for individual omics data. Users can perform clustering
for currently selected data. However, since they are from the same samples (sharing sample names), the sample clustering will be synchronized between the two
omics datasets.
Multi-view clustering refers to clustering samples that have multiple data representations. This is the case for multi-omics
data measured on the same samples, where each data type is a separate representation of the same samples. All multi-view
methods supported by OmicsAnalyst have the same general approach, which involves: 1) computing a sample similarity matrix
from each ‘omics type individually; 2) integrating the individual matrices together; 3) determining the optimal number of
sample clusters in the integrated matrix; and then 4) detecting this number of clusters. One main advantage of multi-view
clustering is that it tends to reduce edges that are due to random noise or platform-specific technical artifacts, as it is
highly unlikely that exact same erroneous effects are present across multiple data sets.
Spectrum is self-tuning spectral clustering method for multi-omics data. It combines the strengths of several other methods:
an adaptive density-aware kernel is used to strengthen connections in the graph based on common nearest neighbours,
a tensor product graph with diffision method is used to reduce noise while integrating different data sources,
a generalized eigengap method is used to automatically determine the optimal number of sample clusters,
and a spectral clustering method is used define sample clusters due to its speed on large graphs.
OmicsAnalyst uses the multi-modality mode in the Spectrum R package, which finds the optimal number of clusters for both Gaussian and
non-Gaussian distributed data. (more details ....)
Similarity Network Fusion (SNF) generates an integrated sample similarity matrix from multiple 'omics datasets
by first computing similarity matrices for each dataset individually, and then fusing them together. Individual similarity
matrices are computed using an exponential similarity kernel that scales the Euclidean distance between samples. These
matrices are then fused together by an iterative approach that adjusts each matrix to make it more similar to the others. The
SNF algorithm is iterated until the matrices converge. OmicsAnalyst then uses the clustering method from the Spectrum R package
to define sample clusters in the SNF matrix (select the Spectrum option for more details).
(more details ....)
Perturbation clustering methods implemented in the PINSPlus R package are founded on the idea that even truly
homogeneous populations will have small differences in 'omics features due to measurement error and natural variability, and
that clusters corresponding to true sub-population should be robust this variation. Their approach is to repeatedly add
small amounts of noise to individual 'omics data, and then cluster the samples. The number of clusters that gives the most stable sample similarity
matrix is retained, and the corresponding similarity matrices from each 'omics are integrated to find connections that are stable
across multiple datasets. Finally, k-means clustering on the integrated matrix is used to group samples into the optimal number of
clusters found in the previous step. This method is not suggested for datasets with large number of samples (>50).
(more details ....)
All of the clustering methods in OmicsAnalyst automatically detect a reasonable number of clusters, however this can be updated
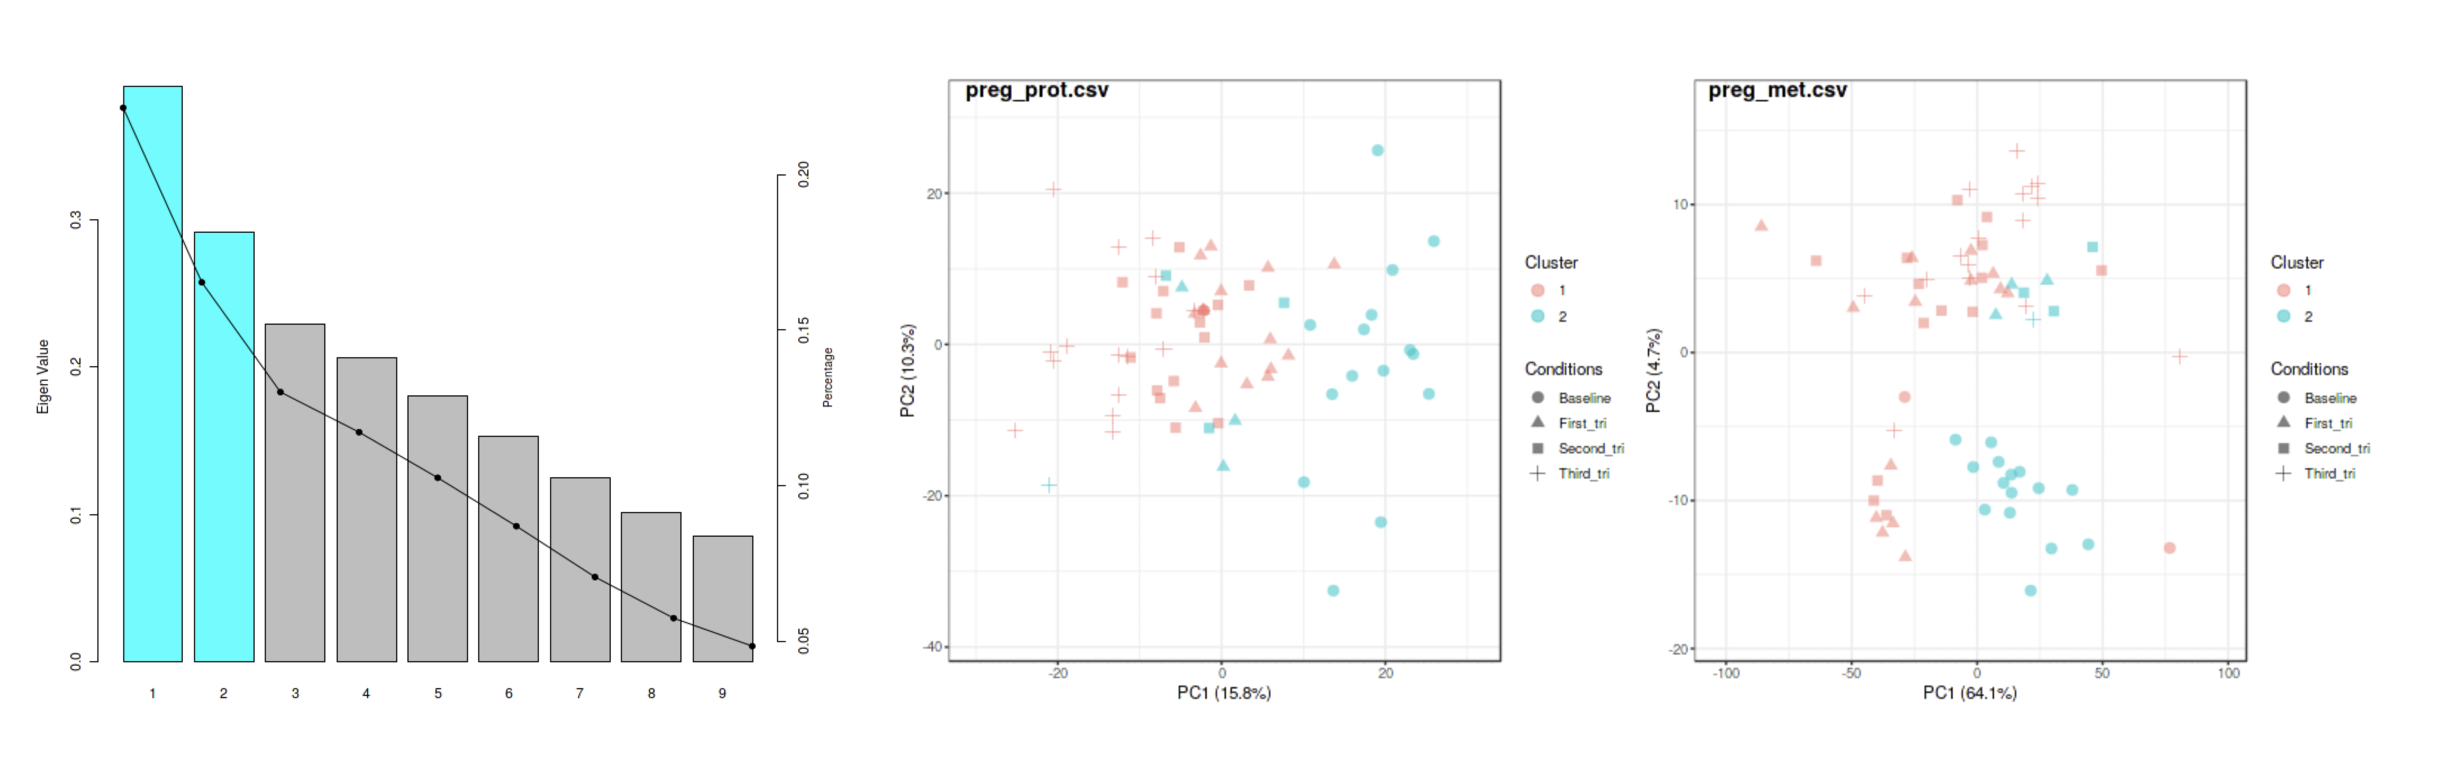
on the parameter tuning page for SNF and Spectrum. Several diagnostic plots are provided to help users decide whether they want
to keep, increase, or decrease the number of clusters to detect for these options. For example, the image below shows the results
from using SNF on the pregnancy example data.
The algorithm determined that two clusters optimize some measure of variance on the integrated proteomics and metabolomics
sample-sample similarity matrix. PCA plots of the individual 'omics data sets show sample-cluster membership.
On the rightmost side of top menu bar, click on "Advanced Options". A dialog containing "Batch Selection" will be displayed. Enter the list of features (can be from both datasets) you wish to be visualized and click on "Submit".
The focus view will be updated if there are matched features.
The objective of this analysis is to perform dimension reduction, and then visually explore corresponding scores, loadings and biplots
in interactive 3D scatter plots to understand the common trends and underlying patterns.
The multivariate dimension reduction techniques are kind of like parallel versions of PCA,
where we try to find sets of multi-dimensional components that both reduce redundant information
within individual datasets, and are related to each other across datasets. These sets of components are related to each
other through some global scores, which are the dimensions that we use to visualize the sample space.
The different methods are mainly distinguished by the way that they optimize similarity of component sets
across the 'omics datasets.
OmicsAnalyst currently supports three commonly used methods including multiple co-inertia analysis (MCIA)
and Data Integration Analysis for Biomarker discovery using Latent cOmponents (DIABLO).
The key distinguishing features between the five dimension reduction algorithms are summarized in the table below:
Algorithm
Symmetry
Orthogonality constraints
Supervision
Unique features
MCIA
Symmetric
Individual and global
Unsupervised
Very similar to the more familiar canonical correlation analysis but is more robust to outliers and has fewer tuneable parameters. Overall, it is performed in a two-step process.
First, a one table dimension reduction method is performed on each individual dataset. Secondly, MCIA projects the two dimensionally reduced matrices into a same hyperspace while imposing the constraint of
maximizing covariance between each matrix.
(more details ....)
DIABLO
Symmetric
Individual and global
Supervised
The only supervised approach. DIABLO is a multi-block partial least squares discriminant analysis (multi PLS-DA), and thus
finds components in the shared covariance space that maximally separate sample groups as specified by the meta-data.
(more details ....)
Note: Symmetry refers to whether the order that the data sets are analyzed/uploaded will give the same (symmetric) or different
(asymmetric) results; Orthogonality constraints refers to which components must be orthogonal to each other - individual only means
components must only be orthogonal within the set computed for a single 'omics data set whereas individual and global means
components must also be orthogonal within the shared co-variance space; Supervision refers to whether the sample takes the sample
labels into consideration when computing the components.
The same methods are available for both visual analytics tracks, however for the network OmicsAnalyst uses the dimension
reduction loading scores to select the top features, prior to constructing and visualizing the selected features in a network,
while the dimension reduction results are directly visualized in the 3D scatter plot. The two tools offer complementary
information on the data. We suggest first performing dimension reduction with the 3D scatter plot to see how well the
reduced dimensions separate interesting groups of samples. Then, these reduced dimensions can be examined in more detail using the
network to see which features they are composed of, and how these features relate to each other.
A biplot overlays a score plot and a loadings plot in a single graph. In the biplot view, points are the projected observations (samples); vectors (arrows)
are the projected variables. If the data are well-approximated by the first three components, a biplot enables you to visualize high-dimensional
data by using a 3D space. You can visualize both the patterns (sample distributions) and the features that driving such patterns.
Points that are close to each other in the biplot represent observations with similar values.
The cosine of the angle between a vector and an axis indicates the importance of the contribution of the corresponding variable to the principal component.
The cosine of the angle between pairs of vectors indicates correlation between the corresponding variables. Highly correlated variables point in similar directions;
uncorrelated variables are nearly perpendicular to each other.
In the "Biplot in Score Space" dialog, select "Custom" under "Feature Selection" drop down menu.
In the text area that appears, enter the list of features to be visualized as projected vectors on the sample space.
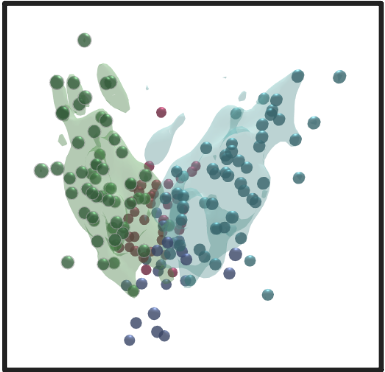
OmicsAnalyst uses kernel density estimation (KDE) from "ks" R package to estimate a probability density function of a random variable.
The resulting probability cloud represents the density estimate containing 75% of all data points from the selected group, and can
help to show separation between sample groups:
There are two options, either to display encasing for individual group of nodes or overall encasing:
Individual meta-data group: under "Overall Pattern" data table, click on "Edit" button corresponding the row corresponding to the meta-data group of interest.
In "Highlight Settings" dialog, "Boundary" drop down menu, select either "Ellipse" for confidence ellipsoids or "Contour" and click on update.
Overall meta-data: Under "Main View" menu, select "Confidence encasing (Score) option. In the newly opened "Encasing Options" dialog, click on "Submit" button to visualize encasing around each meta-data group.
The grey sphere serves a similar purpose to correlation circle in 2D visualization. It helps users to quickly identify features above a certain threshold (0.5 by default) and reduce visual occlusion. The threshold can be changed in "Advanced Options" dialog, "Sphere"
tab.