|
Causal Analysis
Table of Contents
1. Introduction
Causal Analysis is a new component in OmicsAnalyst 2.0 that enables you to move beyond correlation and association to test mechanistic hypotheses about regulatory relationships and driver features in your multi-omics data. This tutorial provides detailed explanations of the methods, parameters, and result interpretation.
OmicsAnalyst 2.0 provides two complementary approaches for causal inference (see Section 3.5 Causal Analysis in Statistical Integration):
- Mediation Analysis: Identify mediating relationships where one omics layer influences another through an intermediate
- Pairwise Linear Model (IntLIM): Test for significant linear relationships between paired features across conditions
- Direct access: Navigate to the Mediation Analysis page directly and manually select your predictor (X), mediator (M), and outcome (Y) variables
- From Correlation/IntLIM results: Click "Analyze" for any feature pair in the Feature Details Table to launch Mediation Analysis with pre-filled variables
For the second approach with step-by-step screenshots, see Direct to Causal Analysis in the Statistical Integration tutorial.
- Causal inference from observational data requires careful assumptions
- Results should be validated with experimental perturbation studies before come to final conclusion
2. Mediation Analysis
Mediation analysis tests whether the relationship between an independent variable (exposure) and a dependent variable (outcome) is transmitted through a third variable (mediator). This is particularly useful for understanding multi-omics regulatory cascades where one omics layer influences another through an intermediate. The analysis uses the mediation R package with bootstrap-based inference.
- Direct access: Go to the Mediation Analysis page and manually select your predictor dataset (X), mediator dataset (M), outcome variable (Y), and specific features to test your hypothesis
- From Correlation Results: Click "Analyze" for significantly correlated feature pairs to test whether a third variable mediates their relationship
- From IntLIM Results: Click "Analyze" for condition-specific feature pairs to explore potential mediating mechanisms
Mediation Model Structure
Example Use Cases
Gene → Protein → Metabolite
Test whether a protein mediates the relationship between gene expression and metabolite abundance. This can validate whether observed correlations reflect direct enzymatic activity.
miRNA → mRNA → Phenotype
Determine whether a target mRNA mediates the effect of miRNA expression on a phenotypic outcome. This validates predicted miRNA-mRNA regulatory relationships.
Treatment → Intermediate → Response
Identify molecular mediators (genes, proteins, metabolites) that transmit treatment effects to clinical outcomes. These mediators are potential biomarkers or therapeutic targets.
Performing Mediation Analysis
- Select Predictor (X): Choose the predictor dataset and feature — the independent variable that initiates the biological cascade. Features are initially sorted by variance, then reordered by correlation strength after selecting a mediator.
- Select Mediator (M): Choose the mediator dataset and feature — the intermediate variable that transmits the effect from X to Y. Features are reordered by correlation with the predictor after selection.
- Select Outcome (Y): Choose the dependent phenotype variable (continuous or binary). For binary outcomes like disease diagnosis, logistic regression will be used automatically.
- Configure Bootstrap: Set the number of bootstrap simulations (1000-5000 recommended) and confidence level (90%, 95%, or 99%).
- Submit & Interpret: Click Submit to run the analysis. Results show direct effects (ADE), indirect effects (ACME), total effects, and proportion mediated with bootstrap confidence intervals.
Mediation Parameters
| Parameter | Description | Recommendation |
|---|---|---|
| Predictor dataset (X) | Omics dataset containing the independent variable | Select based on hypothesis |
| Mediator dataset (M) | Omics dataset containing the intermediate variable | Select based on hypothesis |
| Outcome variable (Y) | Phenotype variable (continuous or binary) | Binary uses logistic regression |
| Bootstrap sims | Number of bootstrap iterations for confidence intervals | 1000-5000 |
| Confidence | Confidence level for effect estimates | 95% |
Mediation Analysis Results
Understanding the Results
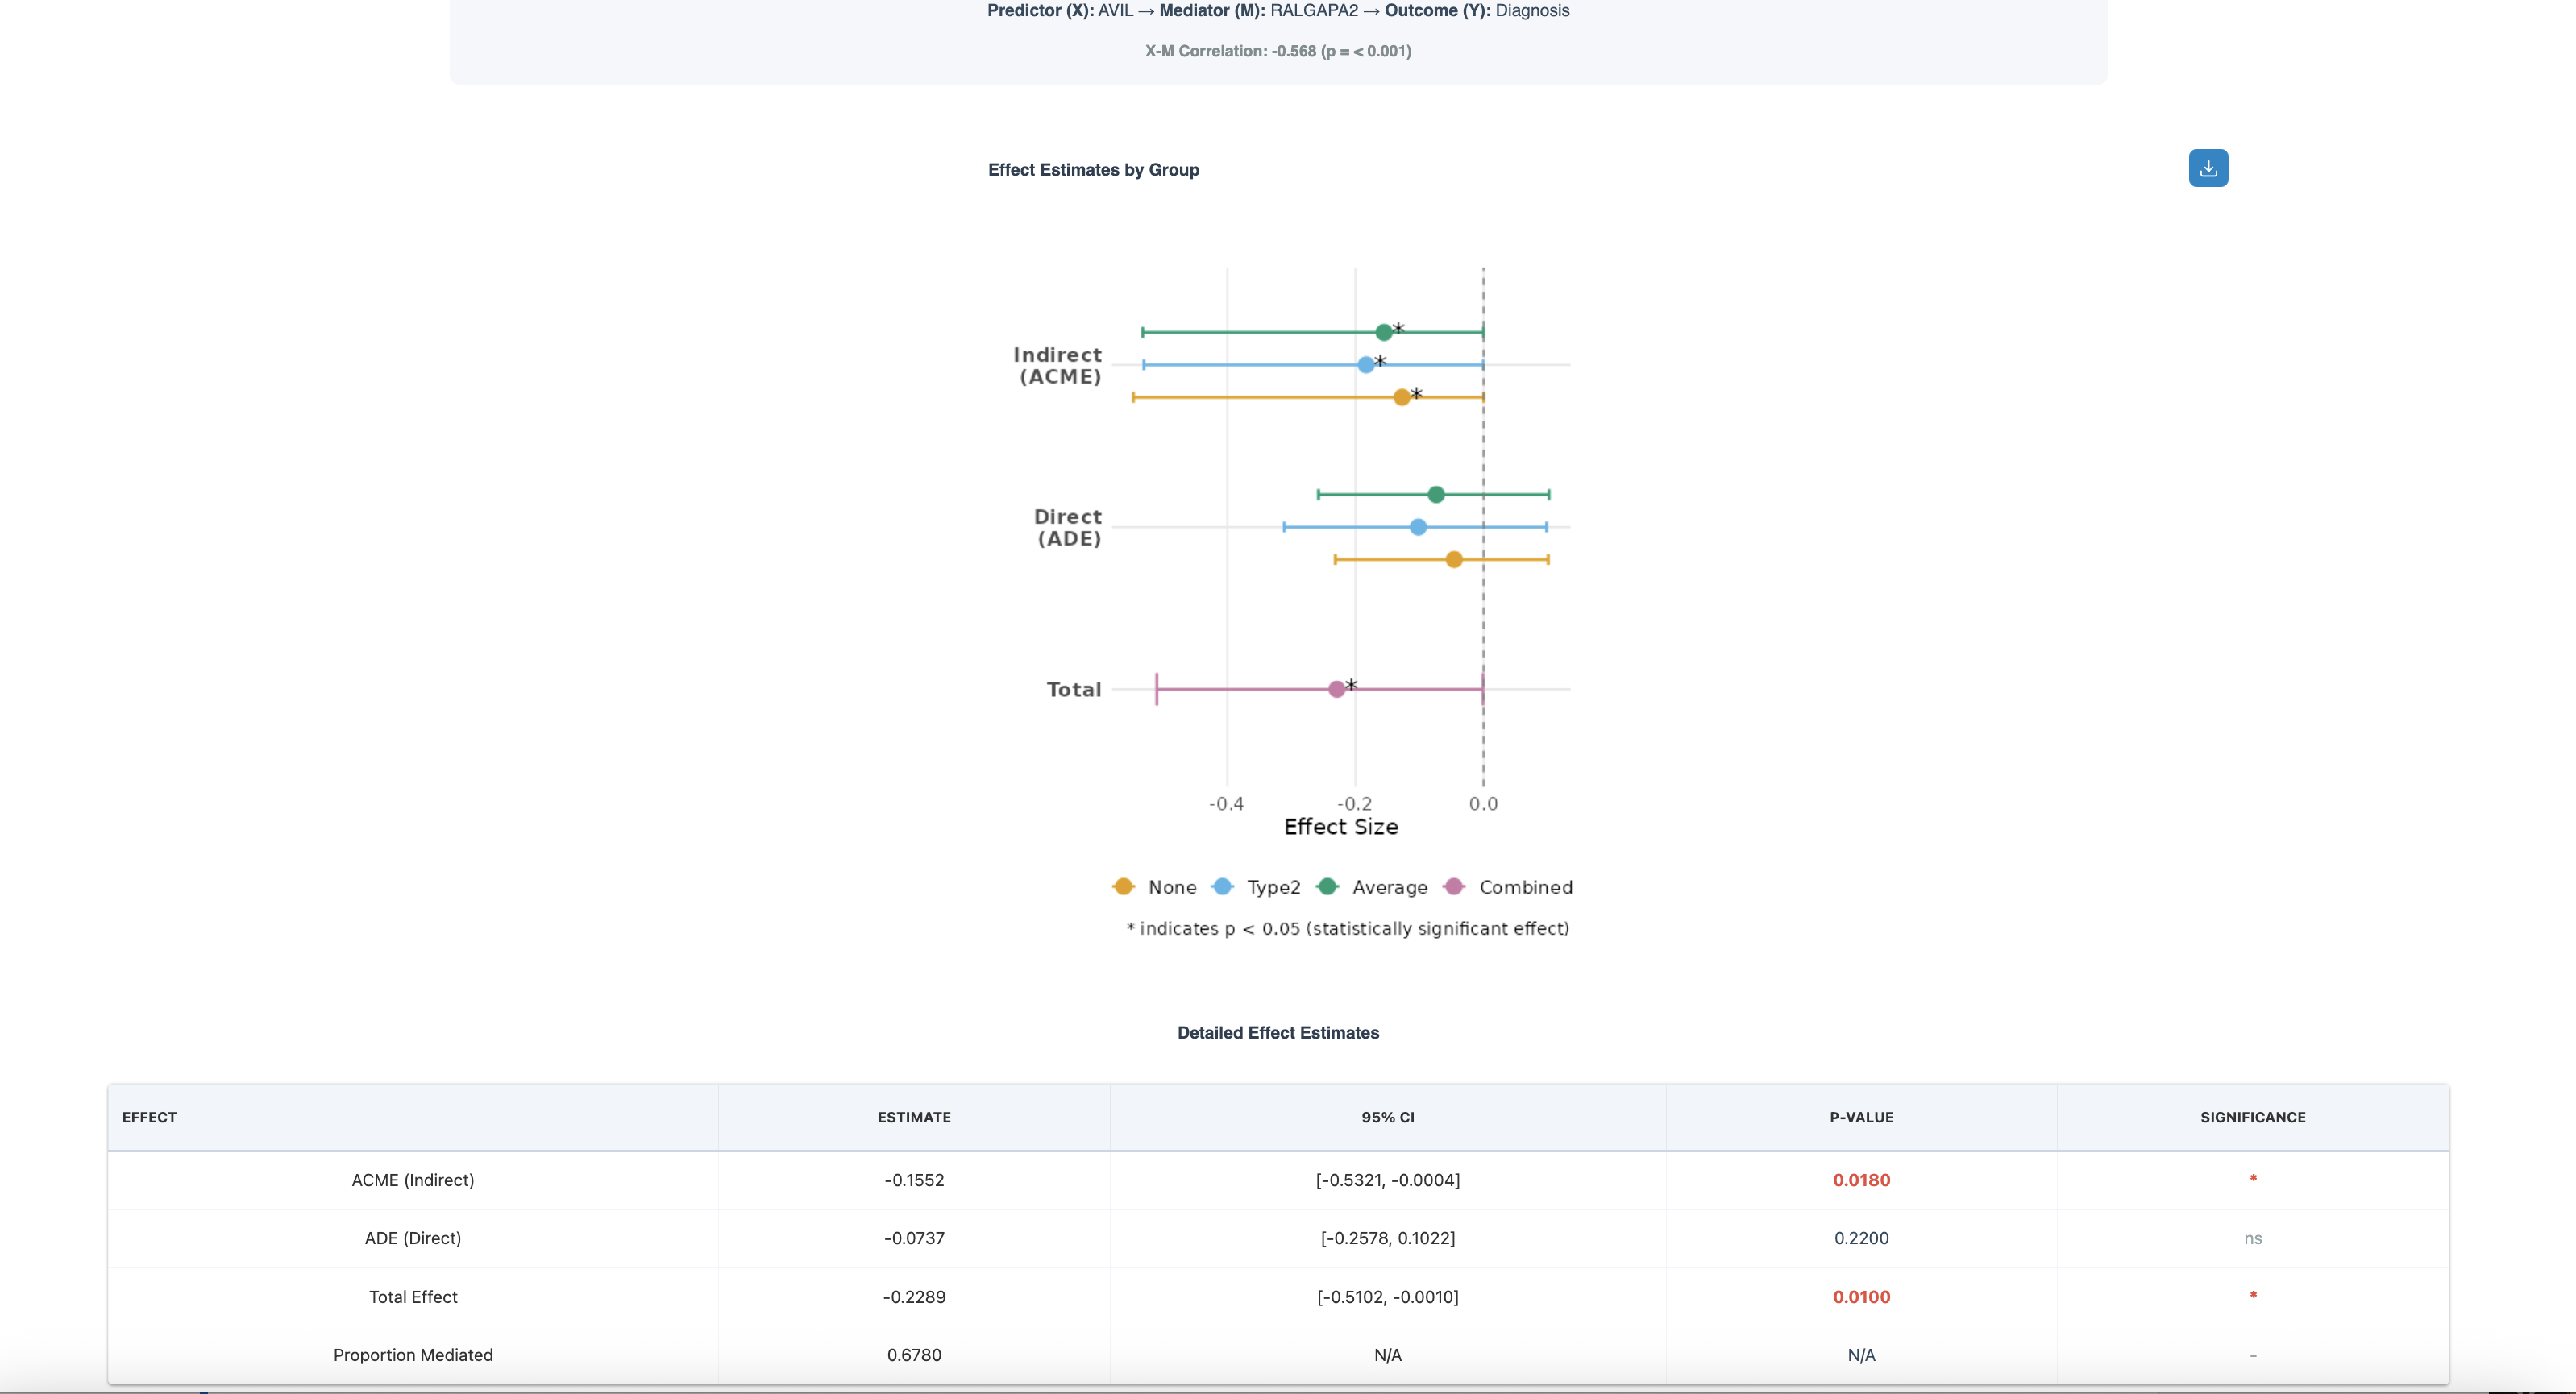
The figure above shows a mediation analysis testing whether RALGAPA2 (protein) mediates the relationship between AVIL (gene expression) and Diagnosis (outcome). The X-M correlation is -0.688 (p < 0.001), indicating a strong negative relationship between the predictor and mediator.
Effect Estimates by Group (Forest Plot):
- Indirect Effect (ACME): Shows effect estimates for None (yellow), Type2 (green), Average (blue), and Combined (gray) groups. The indirect effect through RALGAPA2 is negative, with estimates around -0.15 to -0.4
- Direct Effect (ADE): The direct effect of AVIL on Diagnosis (not through RALGAPA2) is smaller, centered around -0.1
- Total Effect: The combined direct and indirect effects, approximately -0.23
- Asterisk (*): Indicates statistically significant effects (p < 0.05)
Detailed Effect Estimates Table:
- ACME (Indirect): Estimate = -0.1552, 95% CI [-0.5321, -0.0004], p = 0.0180* — Significant mediation effect
- ADE (Direct): Estimate = -0.0737, 95% CI [-0.2578, 0.1022], p = 0.2200 — Not significant, suggesting most effect is mediated
- Total Effect: Estimate = -0.2289, 95% CI [-0.5102, -0.0010], p = 0.0100* — Significant overall relationship
- Proportion Mediated: 0.6780 (67.8%) — RALGAPA2 mediates the majority of AVIL's effect on Diagnosis
Key Mediation Metrics
- ACME (Average Causal Mediation Effect): Magnitude of indirect effect through mediator. In the example above, ACME = -0.1552 indicates that RALGAPA2 transmits a negative effect from AVIL to Diagnosis
- ADE (Average Direct Effect): Effect of exposure on outcome not through mediator. Here, ADE = -0.0737 is non-significant, suggesting the relationship operates primarily through the mediator
- Proportion Mediated: Percentage of total effect explained by mediation (ACME/Total Effect). The 67.8% proportion indicates strong mediation
- P-values: Statistical significance of each effect component — look for significant ACME with 95% CI not crossing zero
- Significant ACME (p < 0.05) with confidence interval not crossing zero
- High proportion mediated (> 50%) — in our example, 67.8% of the effect is mediated
- Reduced or non-significant direct effect after including mediator
- Biologically plausible mechanism — RALGAPA2 is a Ral GTPase activating protein involved in cellular signaling
3. Pairwise Linear Model (IntLIM)
IntLIM (Integration through LInear Modeling) tests for significant linear relationships between paired features across different conditions. It identifies feature pairs whose correlation changes significantly between phenotypic groups, revealing context-dependent regulatory relationships.
What IntLIM Detects
IntLIM tests whether the slope of the relationship between two features (e.g., gene-metabolite, protein-metabolite) differs between phenotypic groups. Significant interactions indicate that the regulatory relationship is condition-specific.
Example: A gene-metabolite pair might show:
- Strong positive correlation in diseased samples
- No correlation in healthy samples
- → Suggests disease-specific metabolic regulation
IntLIM Workflow
- Select Primary Metadata: Choose the categorical variable representing conditions (e.g., disease status, treatment groups). Define reference and contrast groups for comparison.
- Add Covariates (optional): Select additional metadata variables to control for potential confounders like age, sex, or batch effects.
- Select Datasets: Choose predictor and outcome omics datasets. The predictor is hypothesized to influence the outcome in the context of phenotypic variation.
- Set Thresholds: Define coefficient cutoff (top X%) and p-value cutoff (Raw or FDR) to filter significant interactions.
- Submit & Explore: Run analysis and explore the volcano plot. Click points to view condition-specific scatter plots for individual feature pairs.
IntLIM Parameters
| Parameter | Description | Recommendation |
|---|---|---|
| Primary metadata | Categorical variable representing conditions (e.g., disease status) | Select phenotype of interest |
| Reference/Contrast groups | Define which groups to compare | Reference = control, Contrast = treatment |
| Covariates | Additional variables to control for (e.g., age, batch) | Include known confounders |
| Predictor/Outcome datasets | Select two omics layers to test for interactions | Based on hypothesis direction |
| Coefficient cutoff | Filter by top percentage of interaction coefficients | Top 10-20% |
| P-value cutoff | Significance threshold (Raw or FDR-corrected) | 0.05 with FDR |
IntLIM Results
Understanding the Results
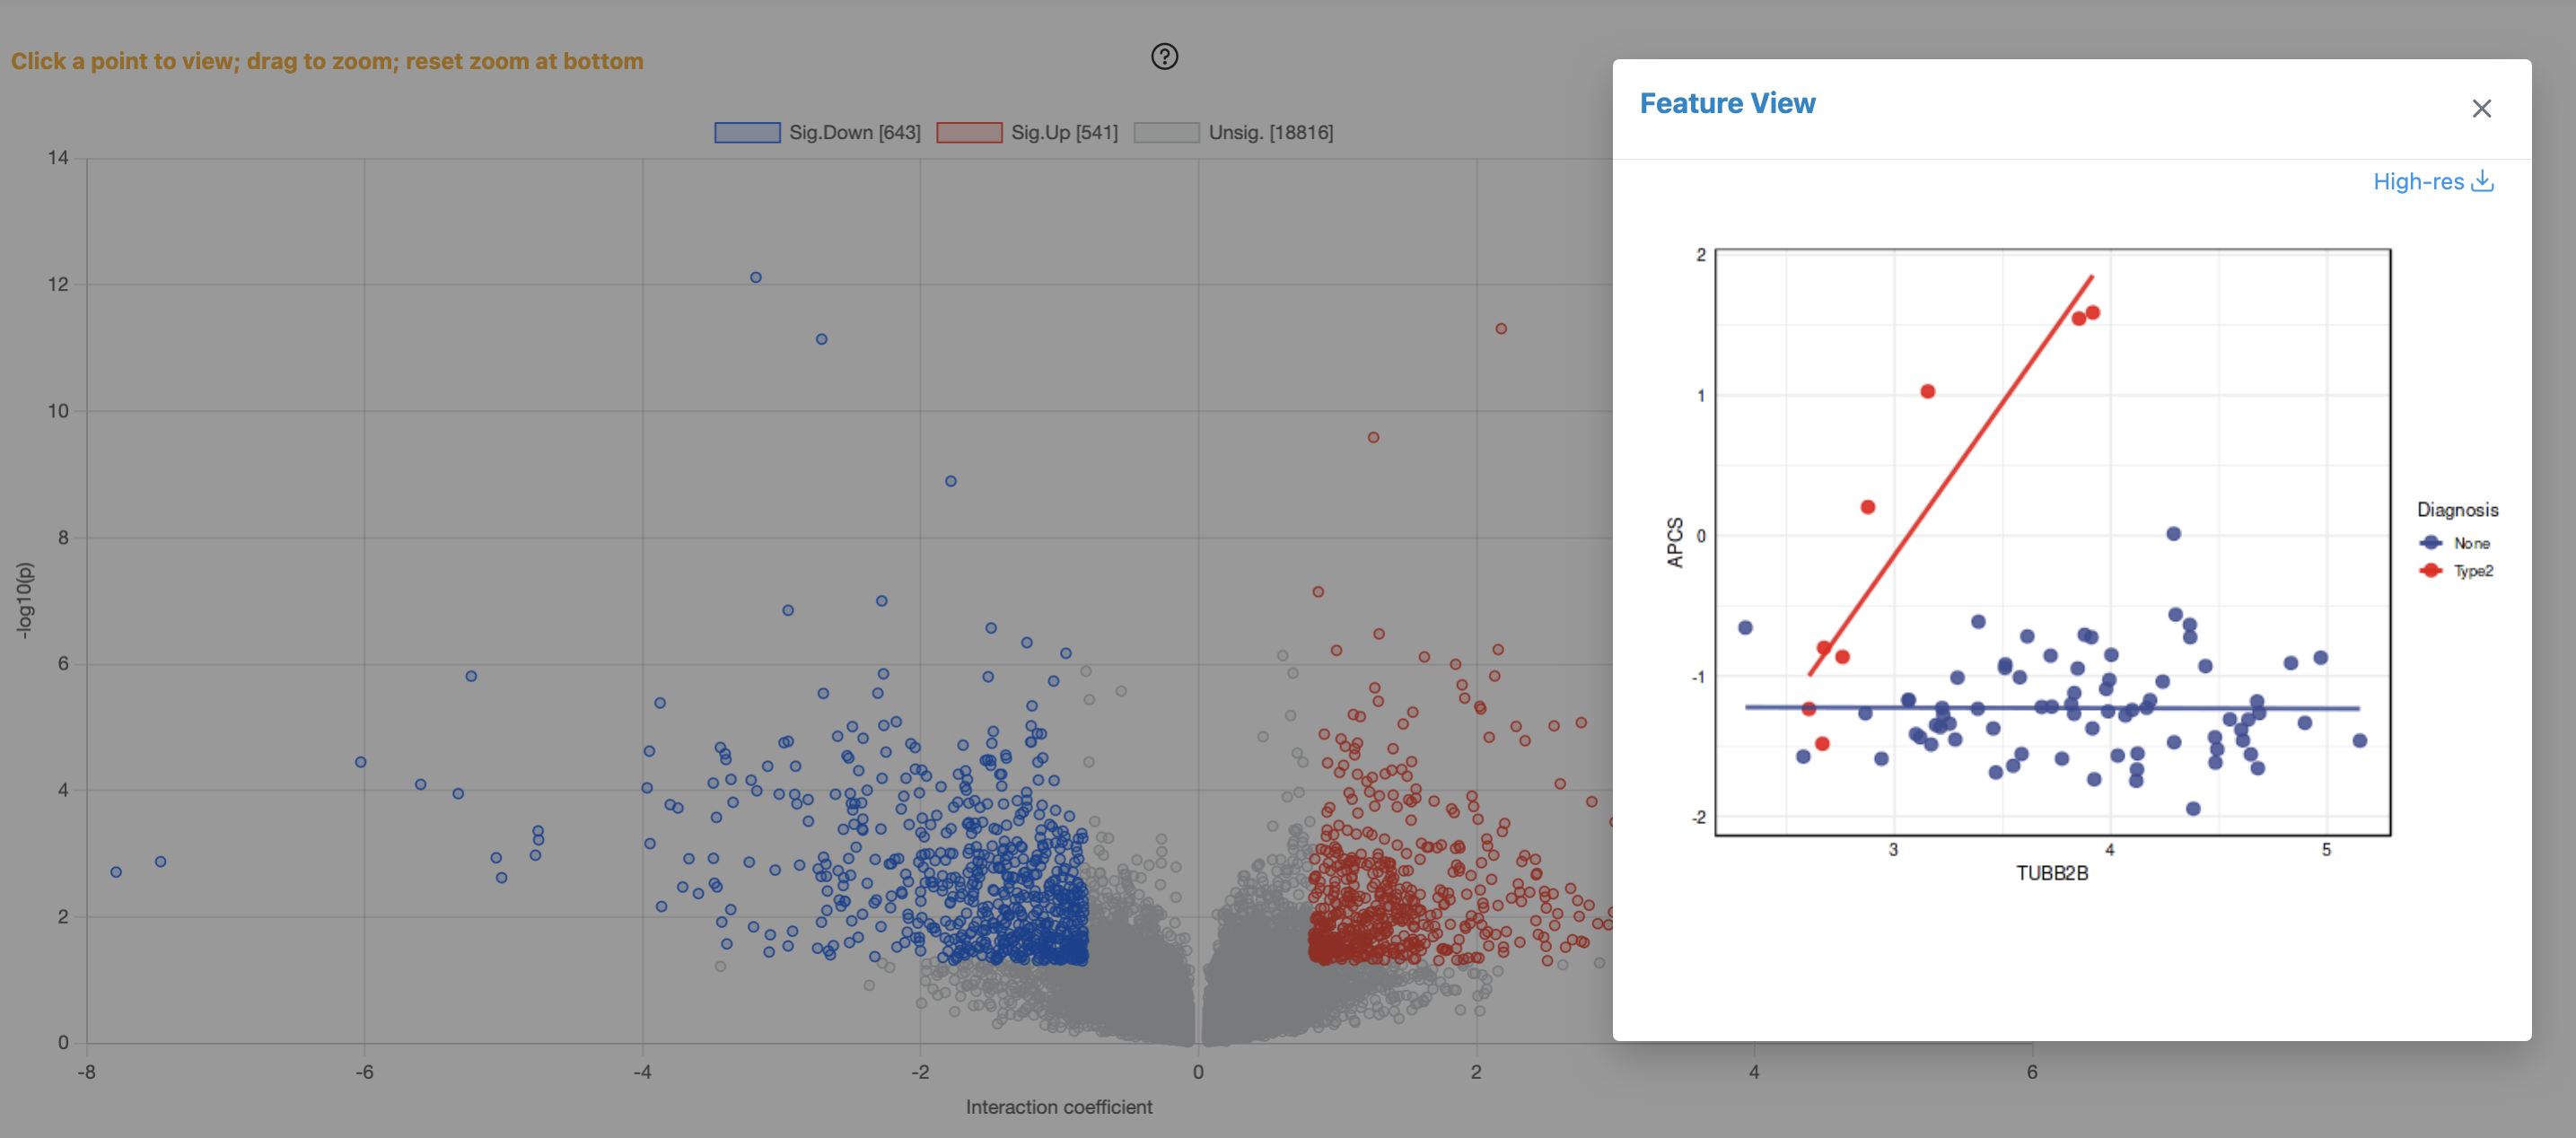
The figure above shows IntLIM results comparing transcriptomics and proteomics data between None and Type2 diagnosis groups. The analysis identified 643 significantly down-regulated pairs (blue), 541 significantly up-regulated pairs (red), and 18,816 non-significant pairs (gray).
Volcano Plot (Left Panel):
- X-axis (Interaction Coefficient): Measures the difference in correlation slopes between conditions. Negative values indicate pairs with stronger correlation in the reference group (None); positive values indicate stronger correlation in Type2
- Y-axis (-log10 p-value): Statistical significance of the interaction. Higher values indicate more significant condition-dependent changes
- Sig.Down [643]: Feature pairs showing significantly decreased correlation in Type2 vs None (blue points)
- Sig.Up [541]: Feature pairs showing significantly increased correlation in Type2 vs None (red points)
- Unsig. [18816]: Non-significant pairs (gray points near the bottom)
Feature View Scatter Plot (Right Panel):
- Condition-specific regression lines: Blue points/line = None group; Red points/line = Type2 group
- Example shown: The selected gene-protein pair (TUBB2B) demonstrates a classic IntLIM finding — strong positive correlation in Type2 (red line with steep slope) but essentially no correlation in None (blue line is flat)
- Biological interpretation: This suggests TUBB2B (beta-tubulin) gene-protein relationship is specifically activated or regulated in the Type2 disease state
IntLIM Output
| Output | Description | Interpretation |
|---|---|---|
| Interaction P-value | Significance of phenotype-dependent correlation change | Lower values indicate stronger evidence for condition-specific regulation |
| Condition-specific Correlations | Correlation coefficients in each phenotype group | Compare magnitudes to understand direction of regulation |
| Scatter Plots | Visualize feature pair relationships by phenotype | Assess linearity and identify outliers |
- Identify condition-specific regulation: As shown in the TUBB2B example, IntLIM reveals gene-protein pairs where correlation exists only in disease state
- Find disrupted regulatory relationships: Pairs with correlation in healthy but not disease may indicate broken regulatory circuits
- Discover therapeutic targets: Disease-specific correlations suggest pathways active only in pathological conditions
- Prioritize validation experiments: With 1,184 significant pairs (643 + 541), focus on biologically relevant candidates first
Accessing Mediation from Correlation/IntLIM Results
In addition to direct access, you can launch Mediation Analysis from Correlation Network or IntLIM results. This approach pre-fills the feature pair, allowing you to quickly test mediation hypotheses for significant associations.
Launching Mediation from Feature Details
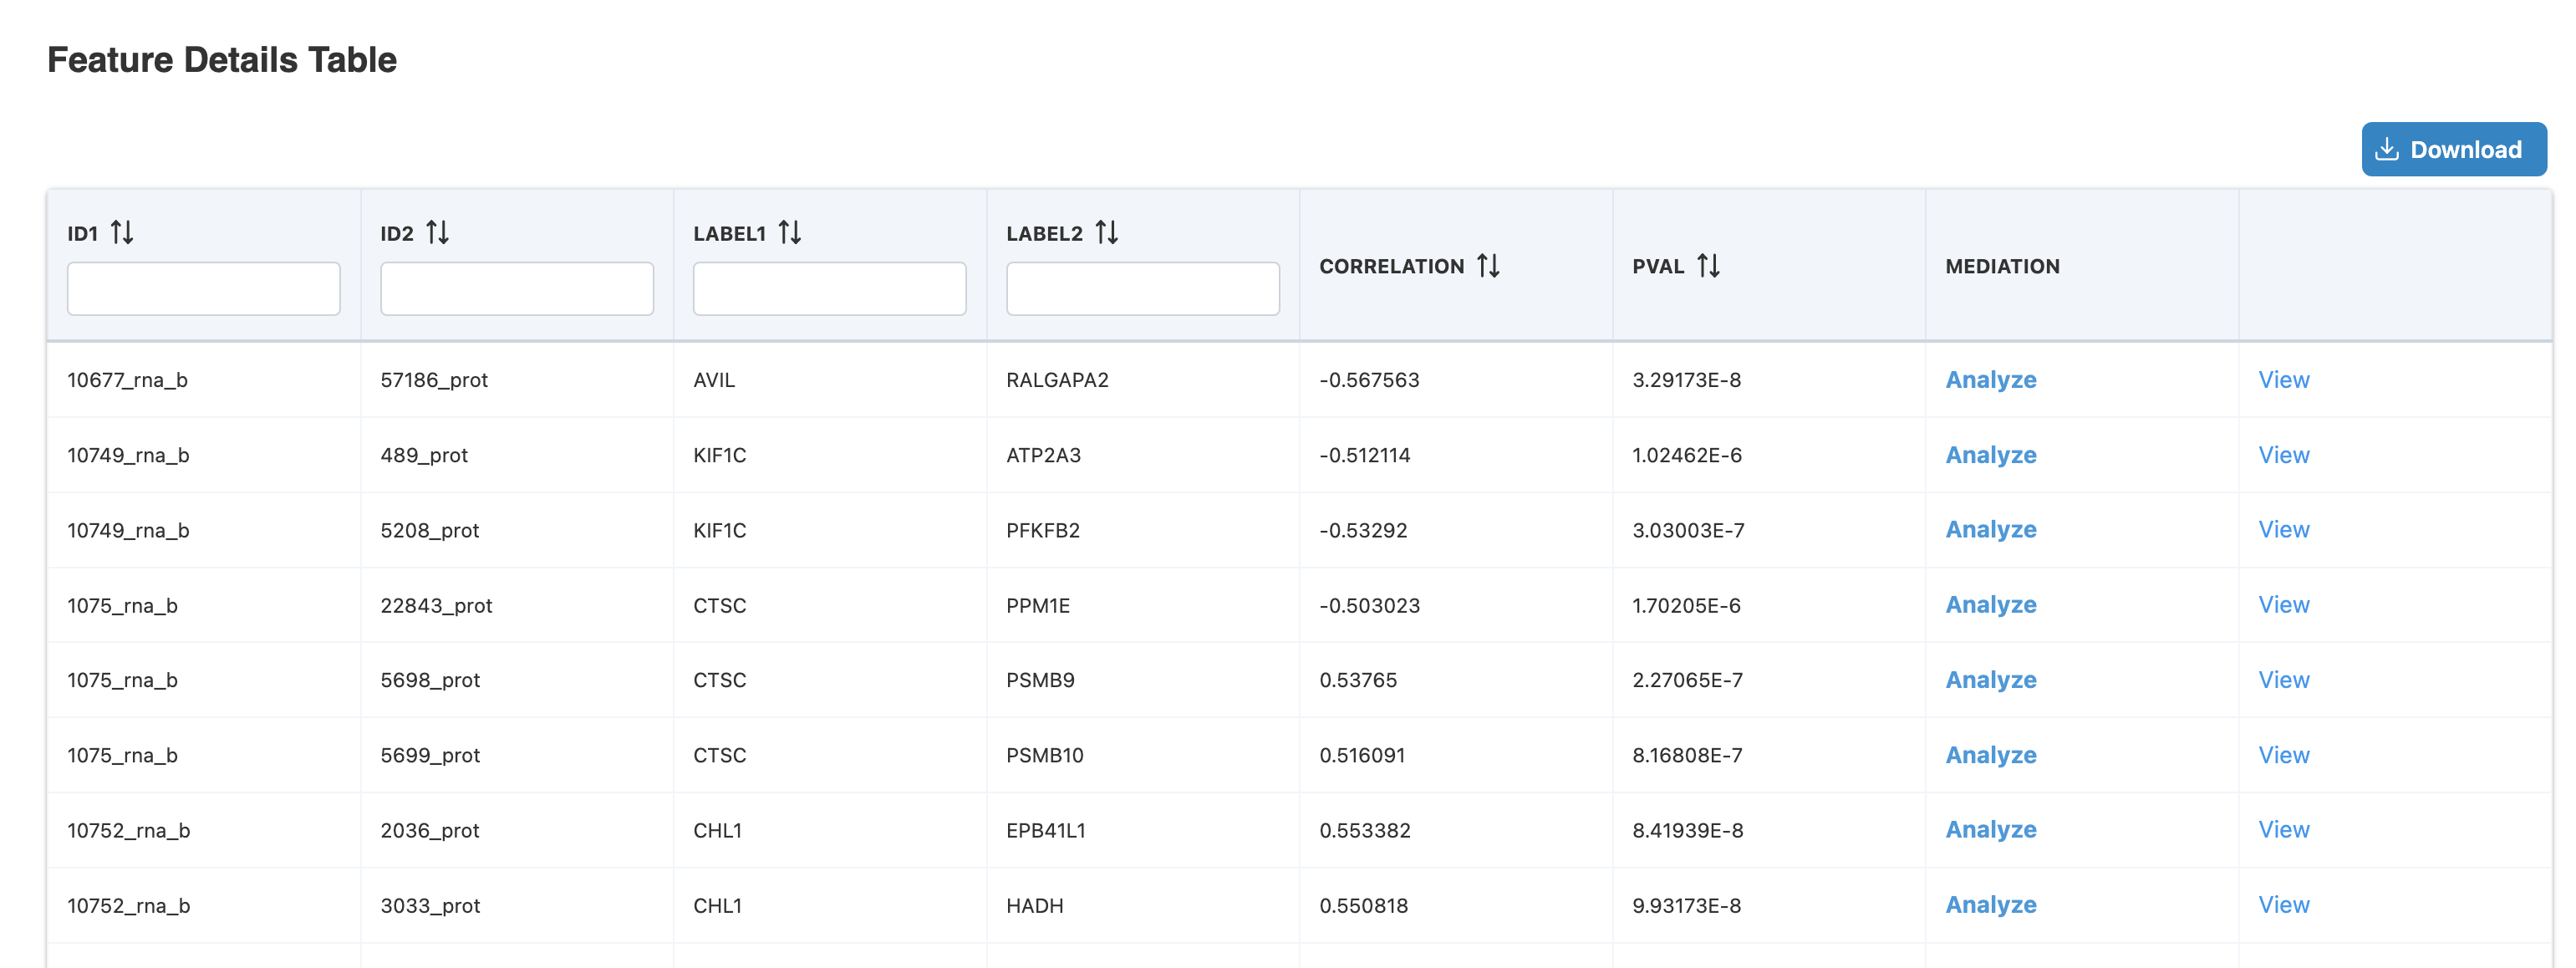
The Feature Details Table displays significant feature pairs from Correlation Network or IntLIM analysis. Each row shows:
- ID1/ID2: Feature identifiers from each omics layer (e.g., 10677_rna_b, 57186_prot)
- LABEL1/LABEL2: Gene/protein names (e.g., AVIL → RALGAPA2)
- CORRELATION: Correlation coefficient between the pair (e.g., -0.567563)
- PVAL: Statistical significance (e.g., 3.29173E-8)
- MEDIATION: Click "Analyze" to launch Mediation Analysis with pre-filled predictor and mediator, or "View" to see existing results
In this example, clicking "Analyze" for the AVIL-RALGAPA2 pair (correlation = -0.567, p = 3.29E-8) opens the Mediation Analysis page with AVIL as predictor and RALGAPA2 as mediator pre-filled. You then select an outcome variable (e.g., Diagnosis) to complete the mediation model.
4. Interpreting Results
Causal analysis results should be interpreted carefully with attention to assumptions, biological plausibility, and validation strategies.
Key Assumptions
- No unmeasured confounding: All relevant confounders are measured and controlled
- Temporal ordering: Cause precedes effect (easier to establish with time-series data)
- No selection bias: Sample selection doesn't distort relationships
- Model specification: Correct functional form for relationships
Biological Plausibility
Always evaluate whether proposed causal relationships make biological sense:
- Is there a known biological mechanism?
- Do the omics layers have direct biochemical relationships?
- Are the effect sizes realistic?
- Is the directionality consistent with molecular biology?
Integration with Other Analyses
Causal analysis becomes more powerful when integrated with other OmicsAnalyst modules:
| Integration | Approach | Benefit |
|---|---|---|
| Statistical → Causal | Test mediation hypotheses for significant correlations | Distinguish direct from indirect effects |
| Network → Causal | Test whether network hubs are mediators or regulators | Validate network topology with causal evidence |
| Causal → Network | Build directed networks from mediation results | Create mechanistic pathway maps |
- What assumptions were made
- What evidence supports causal interpretation
- What alternative explanations were considered
- What validation is needed to confirm findings
5. Next Steps
After completing causal analysis, consider the following validation and follow-up strategies:
Experimental Validation
- Perturbation experiments: Knockdown/overexpression of proposed regulators
- Time-course studies: Measure temporal dynamics to confirm directionality
- Independent cohorts: Replicate findings in validation datasets
- Mechanistic assays: Test proposed molecular mechanisms directly
Complete Workflow Summary
OmicsAnalyst 2.0 provides a complete workflow from data upload to mechanistic insight:
- Data Upload & QC: Prepare and quality-check your multi-omics data
- Statistical Integration: Identify significant features and patterns
- Network Integration: Place findings in biological context
- Causal Analysis: Test mechanistic hypotheses and identify driver features
Return to the Tutorials page to explore other analytical modules or review previous steps in the workflow.
