|
Data Upload and Quality Control
Table of Contents
1. Introduction
This tutorial covers Upload Mode 1 (Data Tables) for Statistical Integration in OmicsAnalyst 2.0. After uploading your data tables and metadata file, you will use the Multi-omics Data Harmonization page to review, edit, and prepare your data for downstream analysis.
2. Data Format Requirements
Required Files
- Metadata file: A single file describing sample information and experimental factors
- Data tables: At least two omics data tables (expression/abundance matrices)
Supported File Formats
| Format | Extension | Max Size |
|---|---|---|
| CSV | .csv | 50 MB (Genes/mRNAs), 25 MB (others) |
| TXT | .txt | 50 MB (Genes/mRNAs), 25 MB (others) |
| TSV | .tsv | 50 MB (Genes/mRNAs), 25 MB (others) |
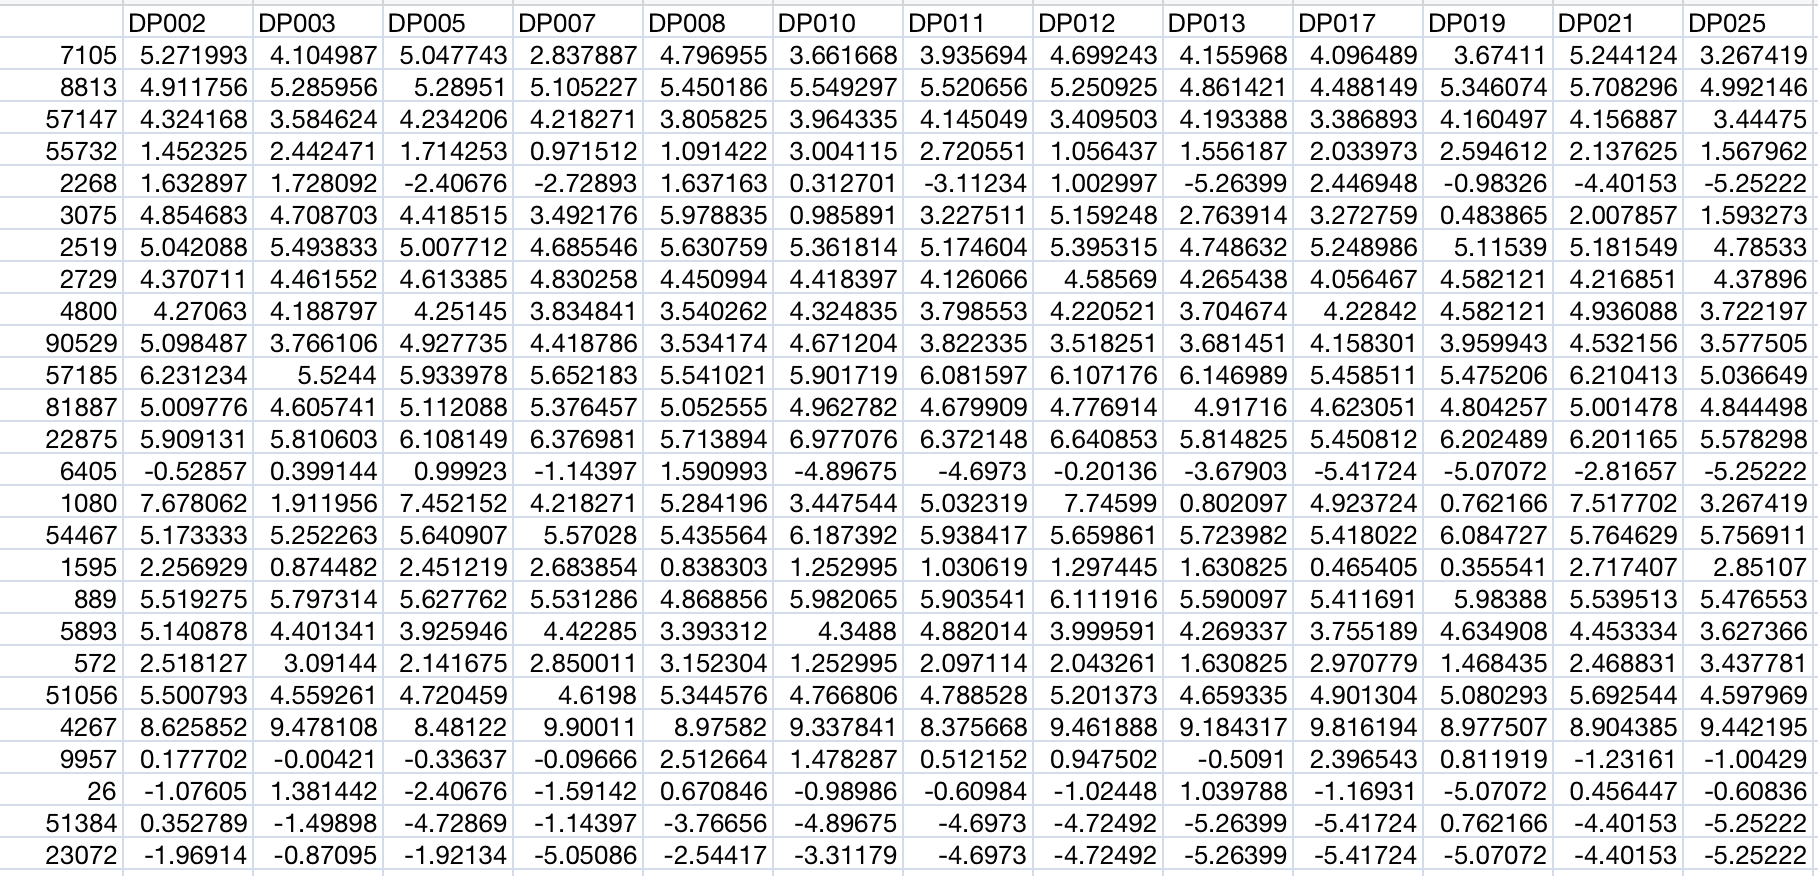
Data Table Structure
Each omics data table should follow this structure:
- First column: Feature identifiers (gene symbols, protein IDs, metabolite names, etc.)
- Subsequent columns: Sample measurements (one column per sample)
- First row: Header with sample names matching the metadata file
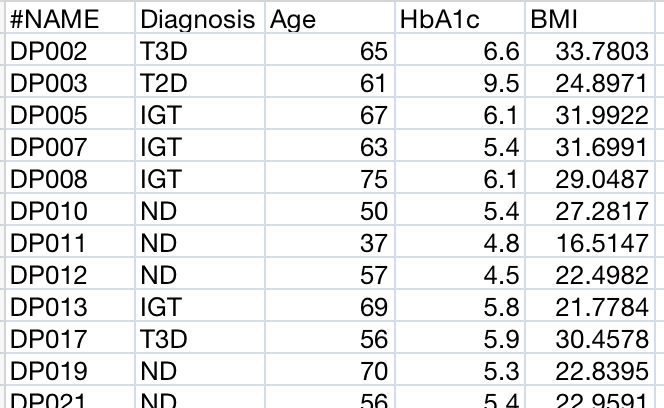
Metadata File Structure
A metadata file describing sample information is required:
- First column: Sample names (must match column headers in data files)
- Second column: Primary study factor (group/condition) - no missing values allowed
- Additional columns: Other sample attributes (batch, clinical variables, etc.)
Supported Omics Types and ID Formats
| Omics Type | Supported ID Formats |
|---|---|
| Genes/mRNAs | Entrez ID, Ensembl Gene ID, Official Gene Symbol, RefSeq ID |
| Proteins | UniProt Protein ID, Entrez ID, Ensembl Gene ID, Official Gene Symbol |
| miRNAs | miRBase mature ID, miRBase accession, miRBase ID (e.g., hsa-miR-21) |
| Metabolites | KEGG ID, PubChem ID, HMDB ID, Common Name |
| Microbiome | Taxonomy label, OTU ID (Phylum to Strain level) |
3. Metadata Overview
After uploading your files, you will see the Metadata Overview tab where you can review and edit your metadata before proceeding to analysis.
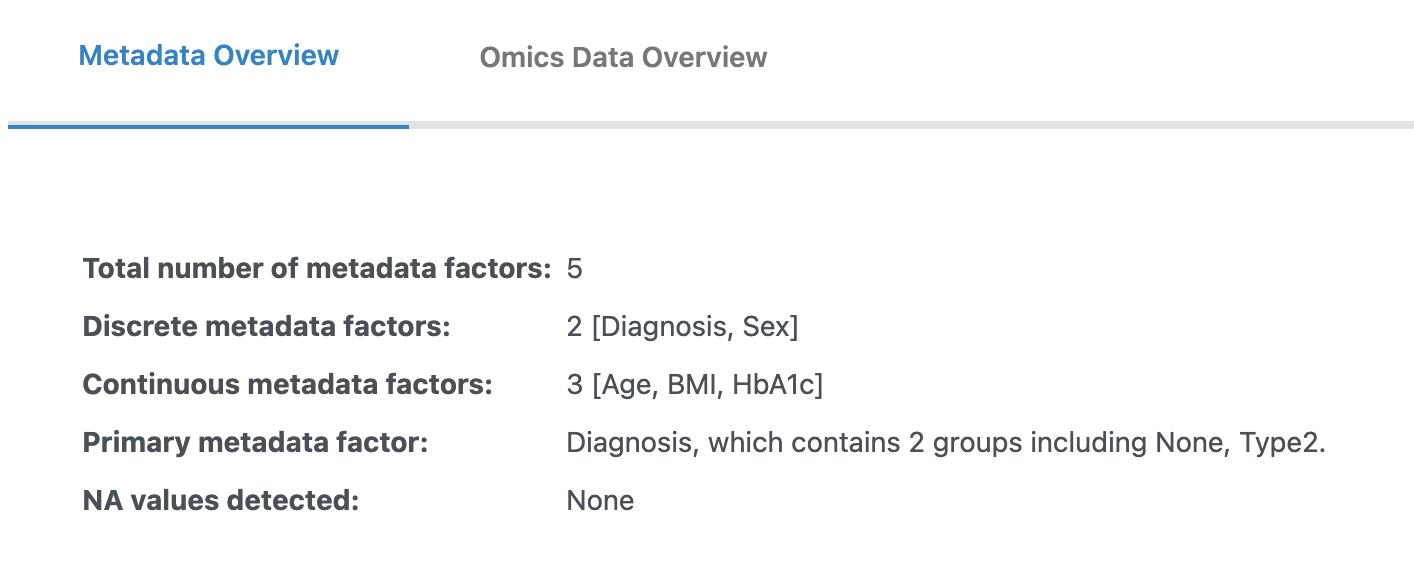
Metadata Type Settings
Ensure the type (discrete or continuous) for each metadata column is correct:
- Discrete (Categorical): For experimental groups (e.g., control vs. diseased). Requires at least two groups and three replicates per group.
- Continuous: For numerical measures. All values must be numerical.
Metadata Editor
The metadata editor provides several functions to prepare your metadata:
Edit Metadata Button
Click the "Edit metadata" button to access the following options:
- Include/Exclude columns: Select which metadata columns to include in your analysis
- Primary metadata: Set the main metadata of interest (only categorical type accepted)
- Order (factor-level): Reorder the levels of categorical metadata for display and analysis
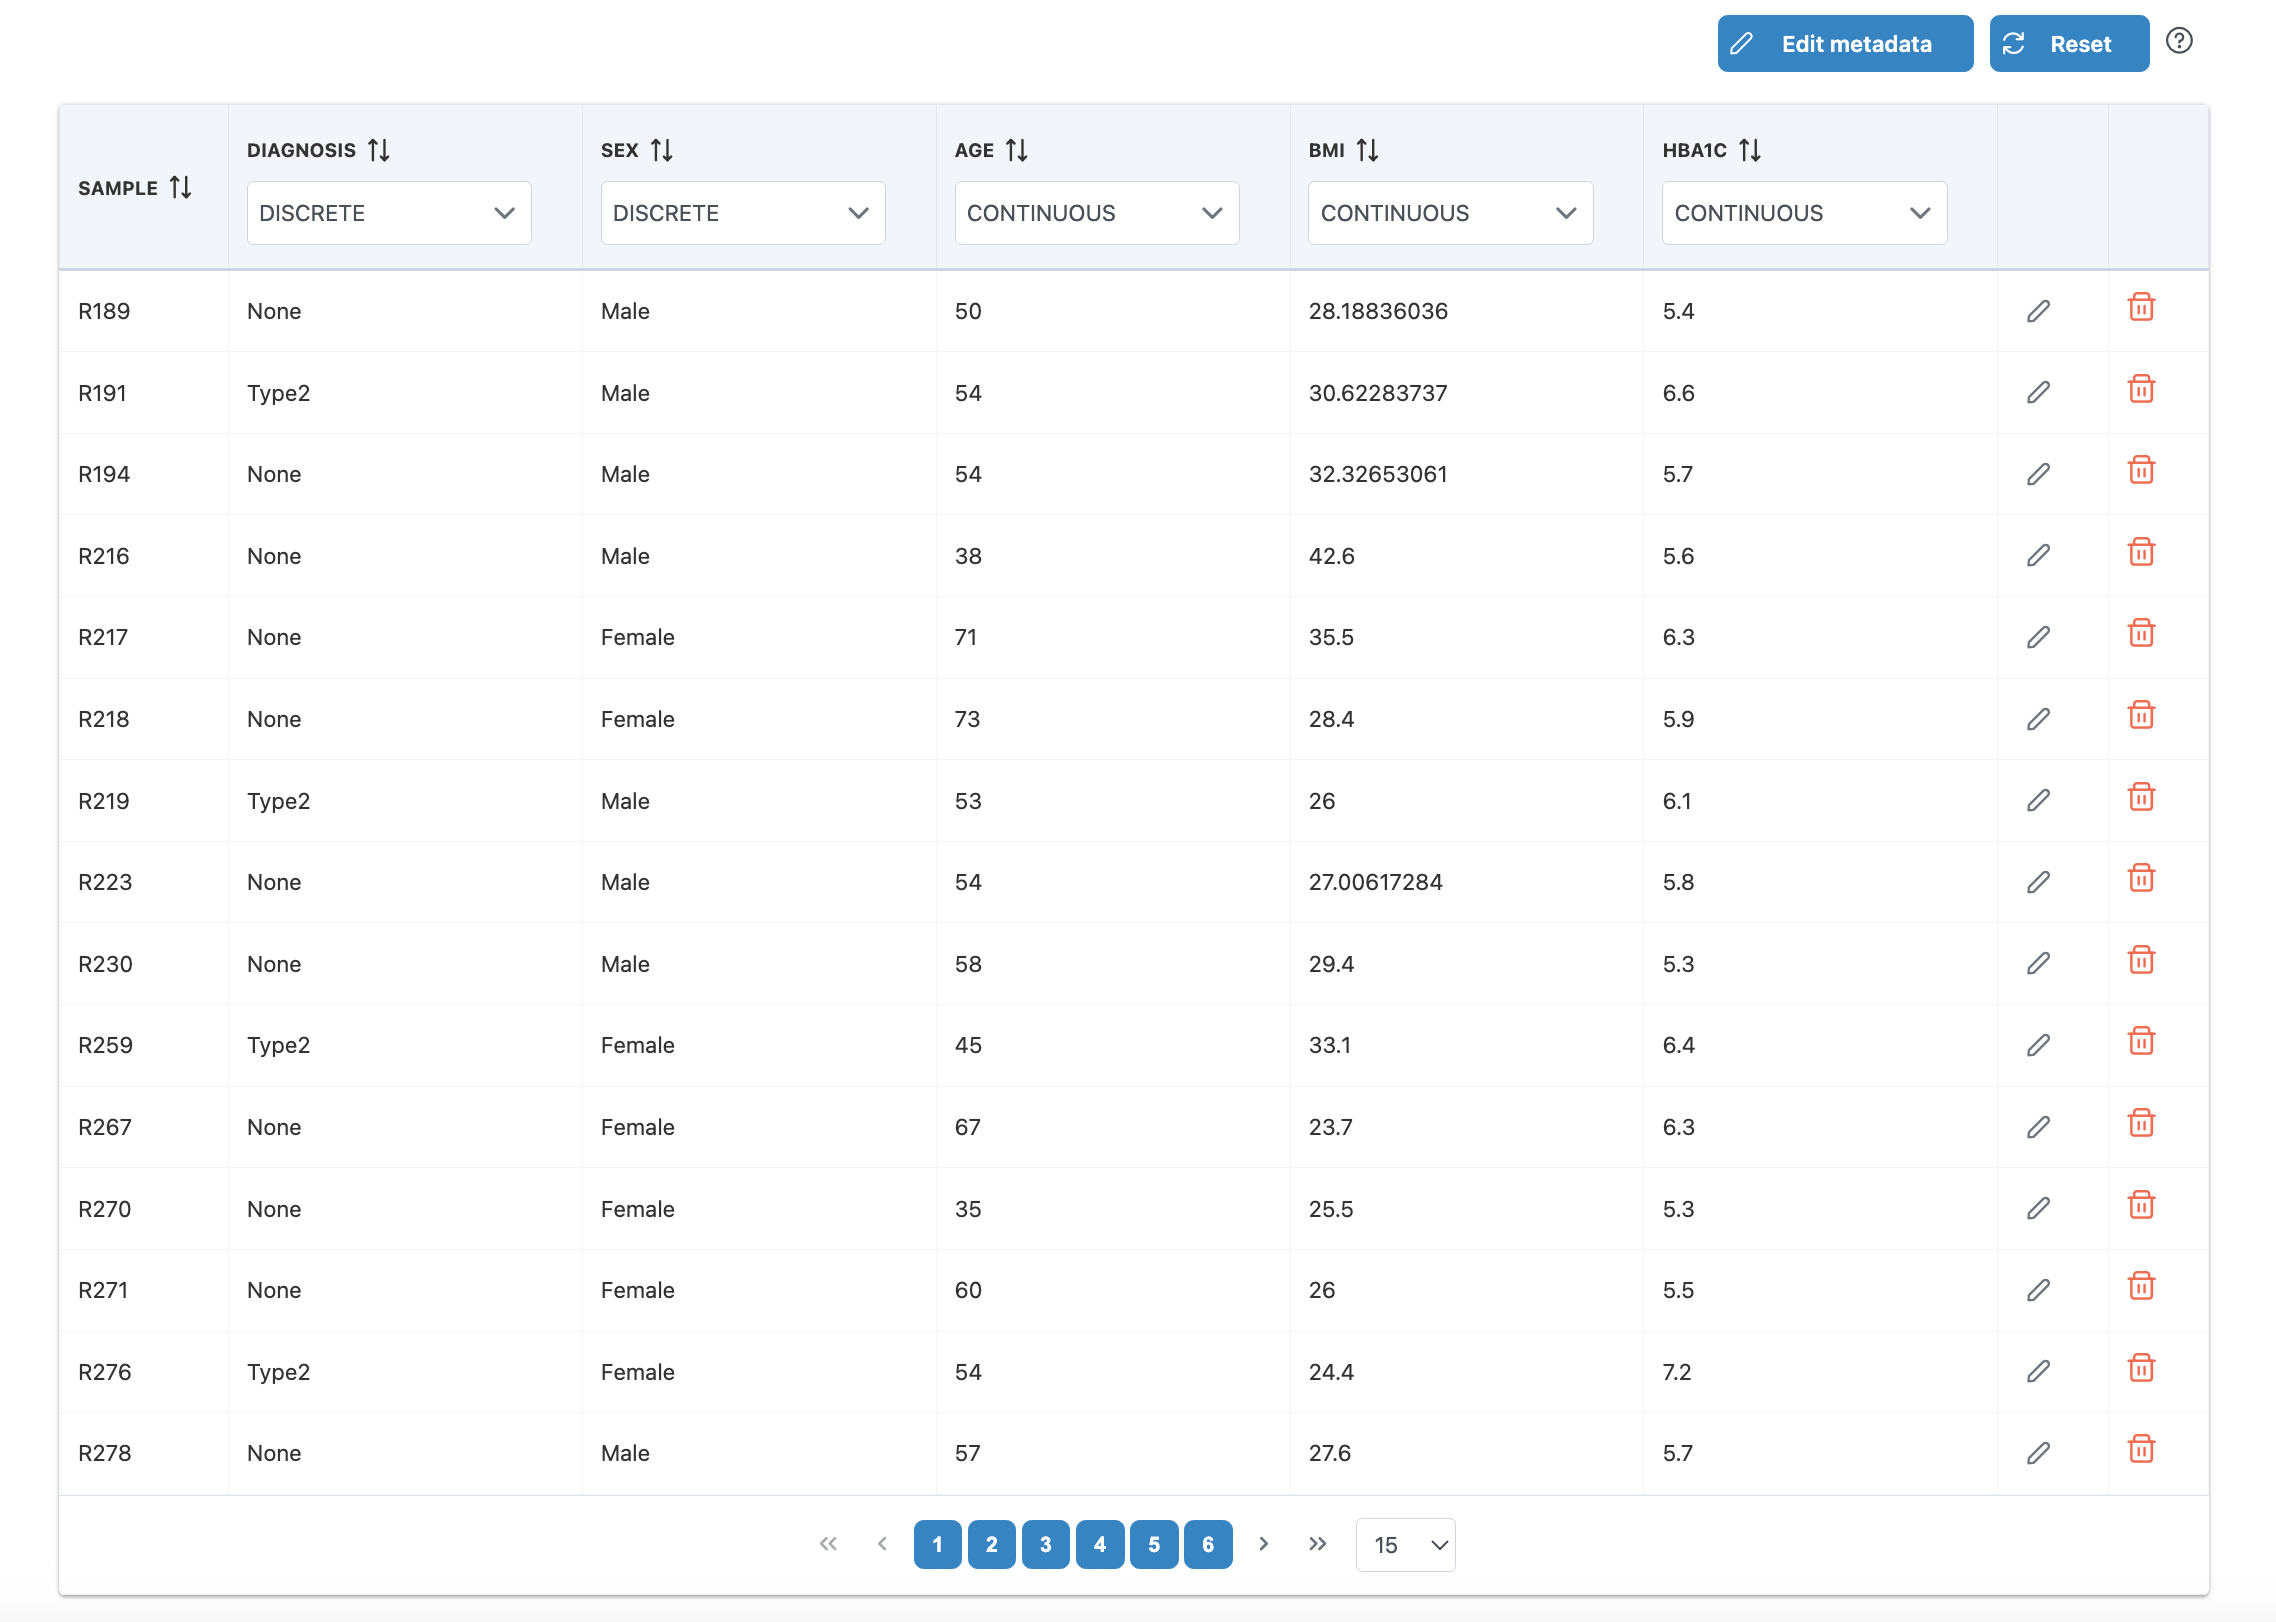
Row-Level Editing
- Edit values: Click the edit icon on any row to modify sample metadata values
- Remove samples: Click the trash icon to exclude samples that don't meet requirements
- Reset: Click "Reset" to restore the original metadata
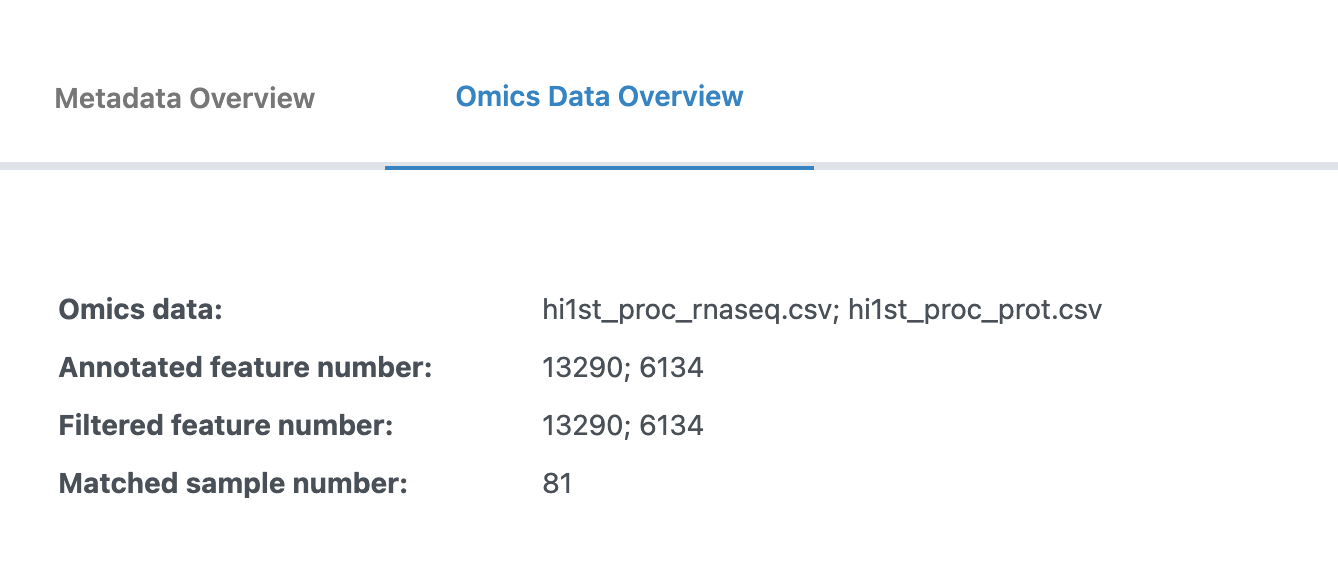
4. Omics Data Overview
The Omics Data Overview tab allows you to apply data processing and visualize quality control plots.
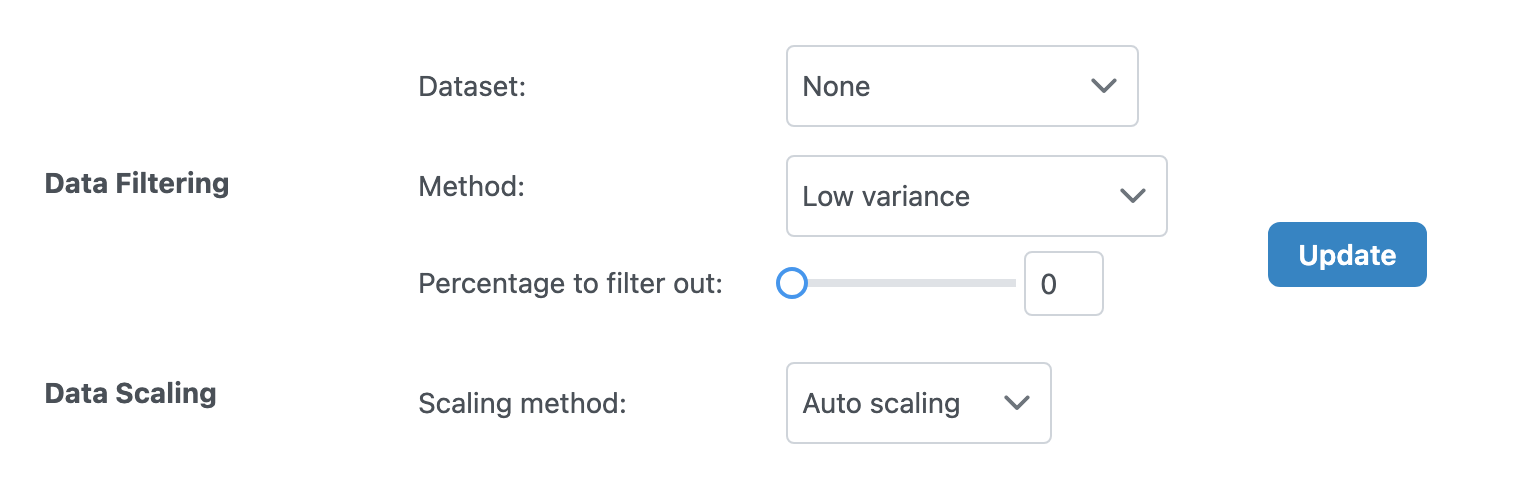
Data Filtering
Filter out low-quality or uninformative features:
| Option | Description |
|---|---|
| Dataset | Select which dataset to filter, or "Apply to all" for all datasets |
| Method | Filtering method (e.g., variance-based, mean-based) |
| Percentage to filter out | Percentage of features to remove (0-100%) |
Data Scaling
Scale your data to make different omics layers comparable:
| Method | Description | Best For |
|---|---|---|
| None | No scaling applied | Data already normalized |
| Auto Scaling | Mean-center and divide by standard deviation | General purpose, most multi-omics analyses |
| Pareto Scaling | Mean-center and divide by square root of standard deviation | Metabolomics data |
| Range Scaling | Scale to 0-1 range | When absolute ranges matter |
Click the "Update" button to apply your filtering and scaling choices.
Quality Control Plots
Two key visualizations help you assess data quality:
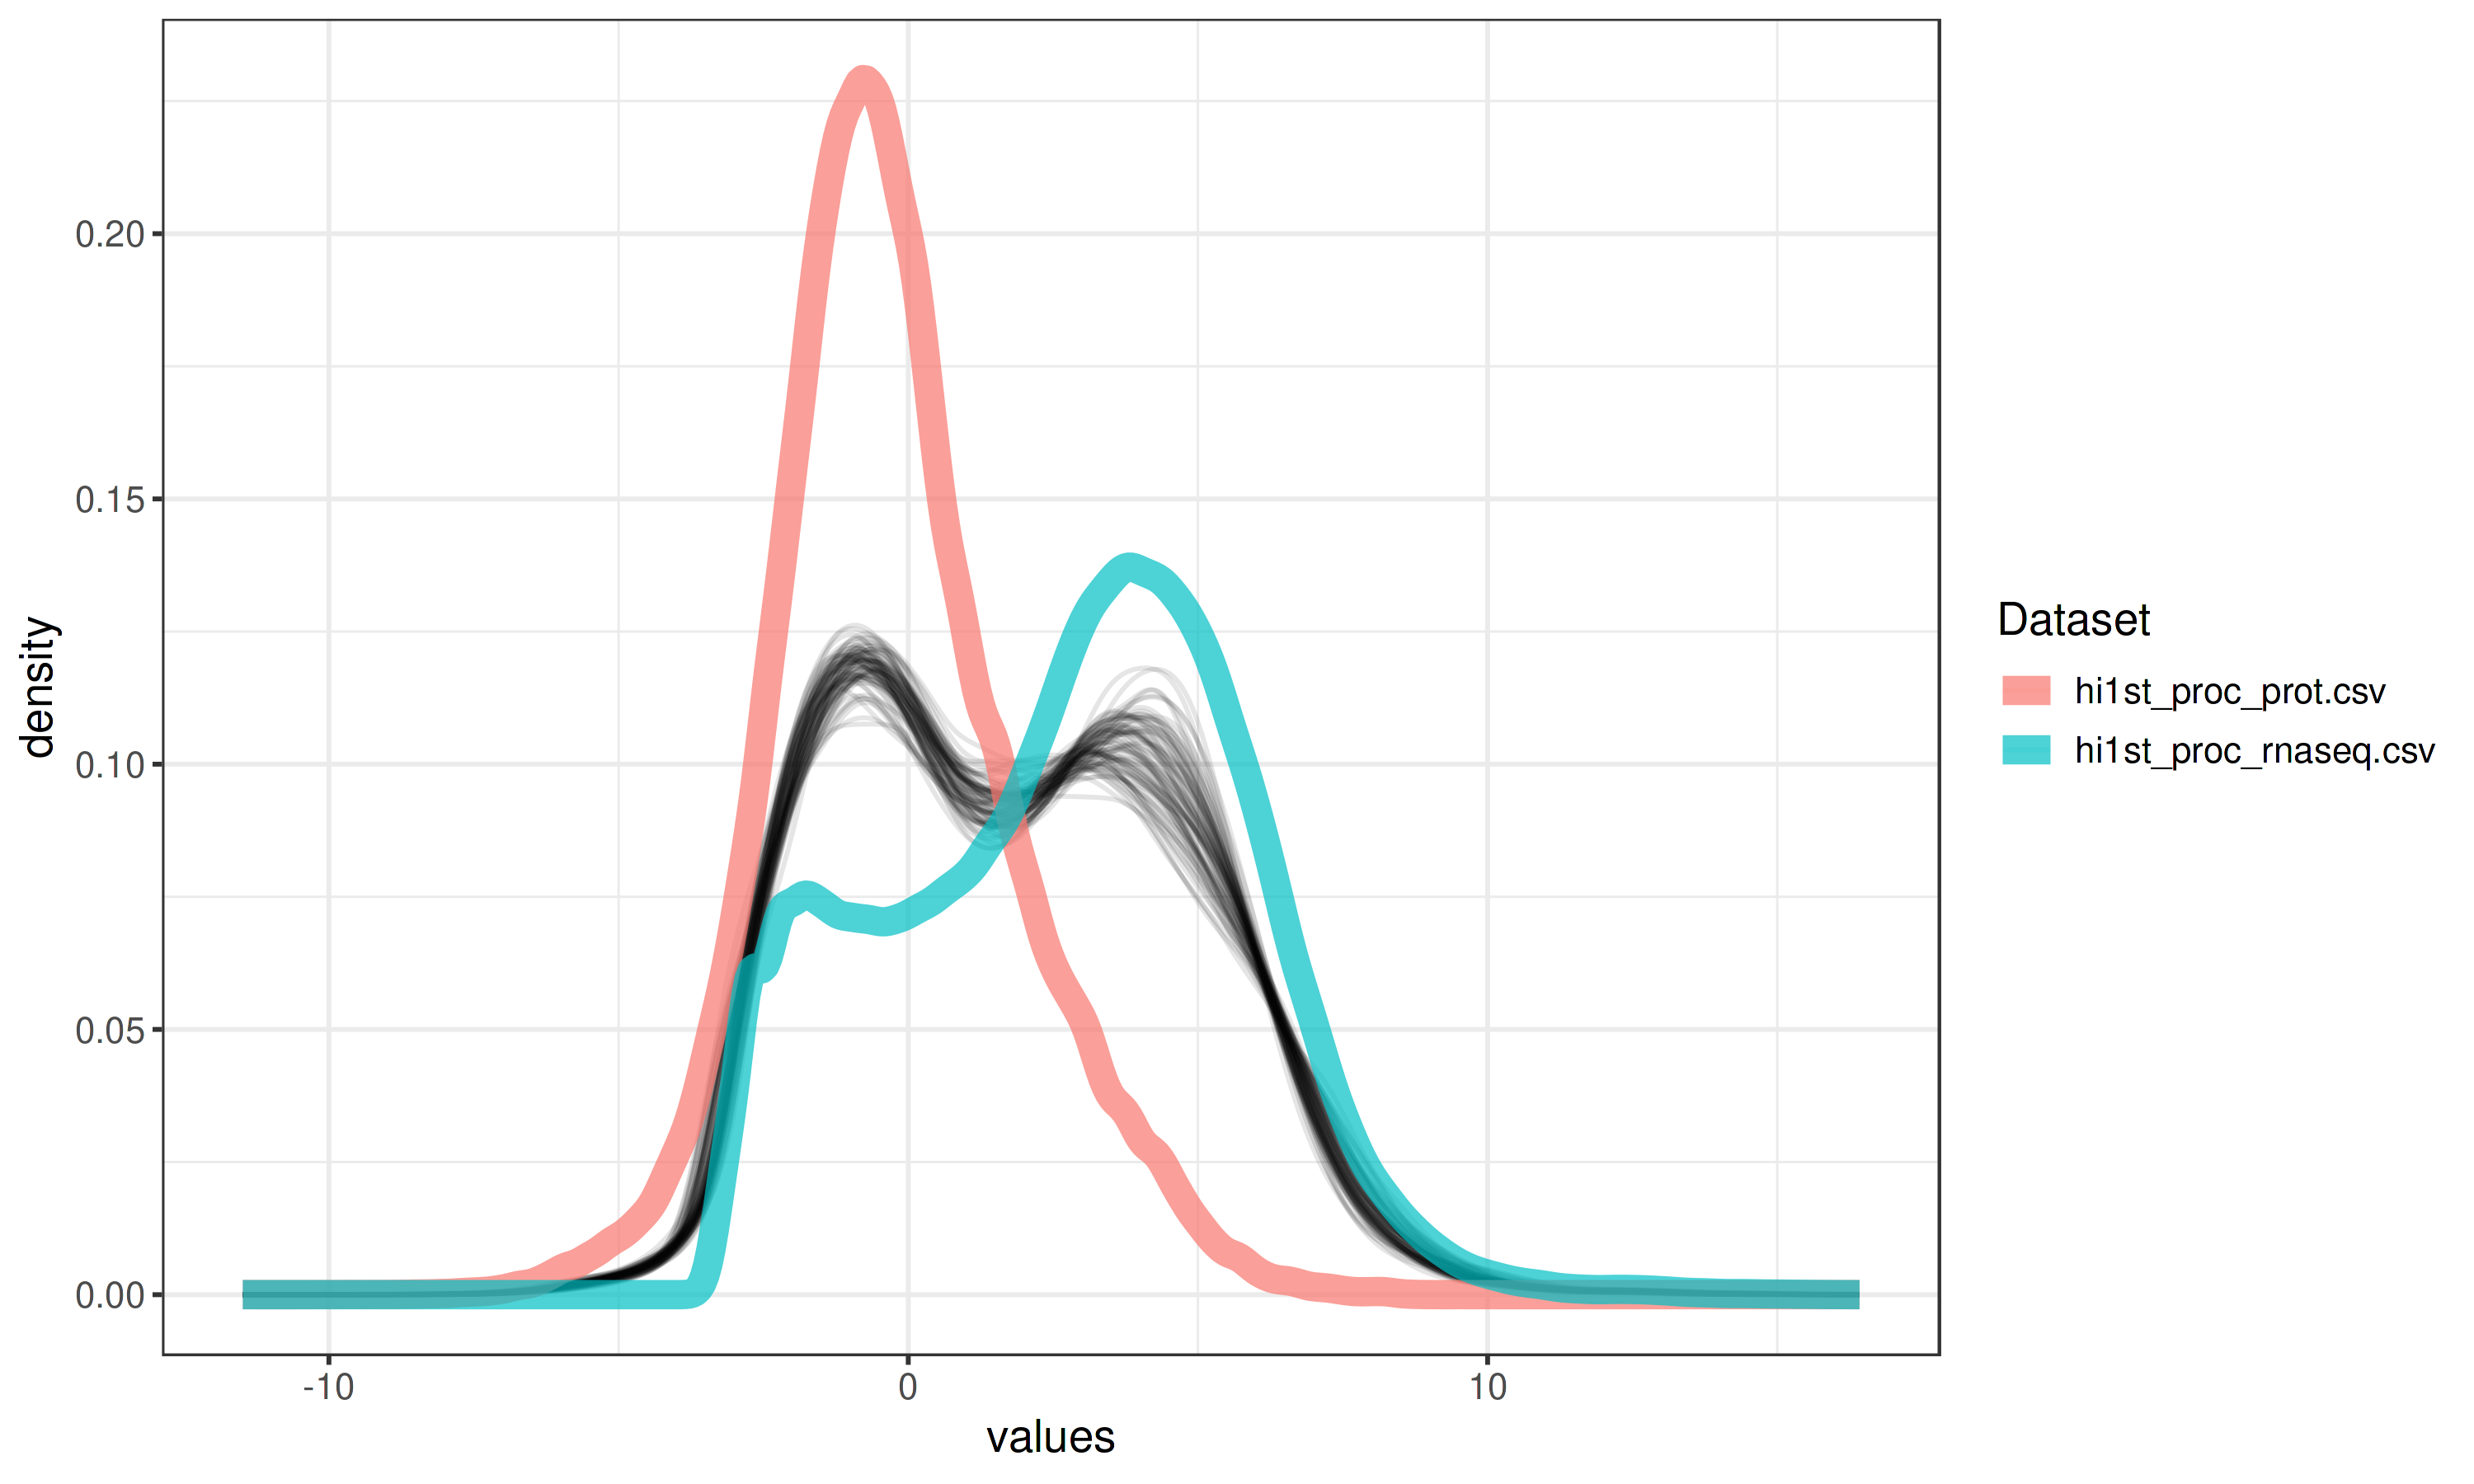
Density Plot
The aggregated density plot compares the distributions across different omics layers. If the overall distributions are in very different ranges, it is advised to perform scaling.
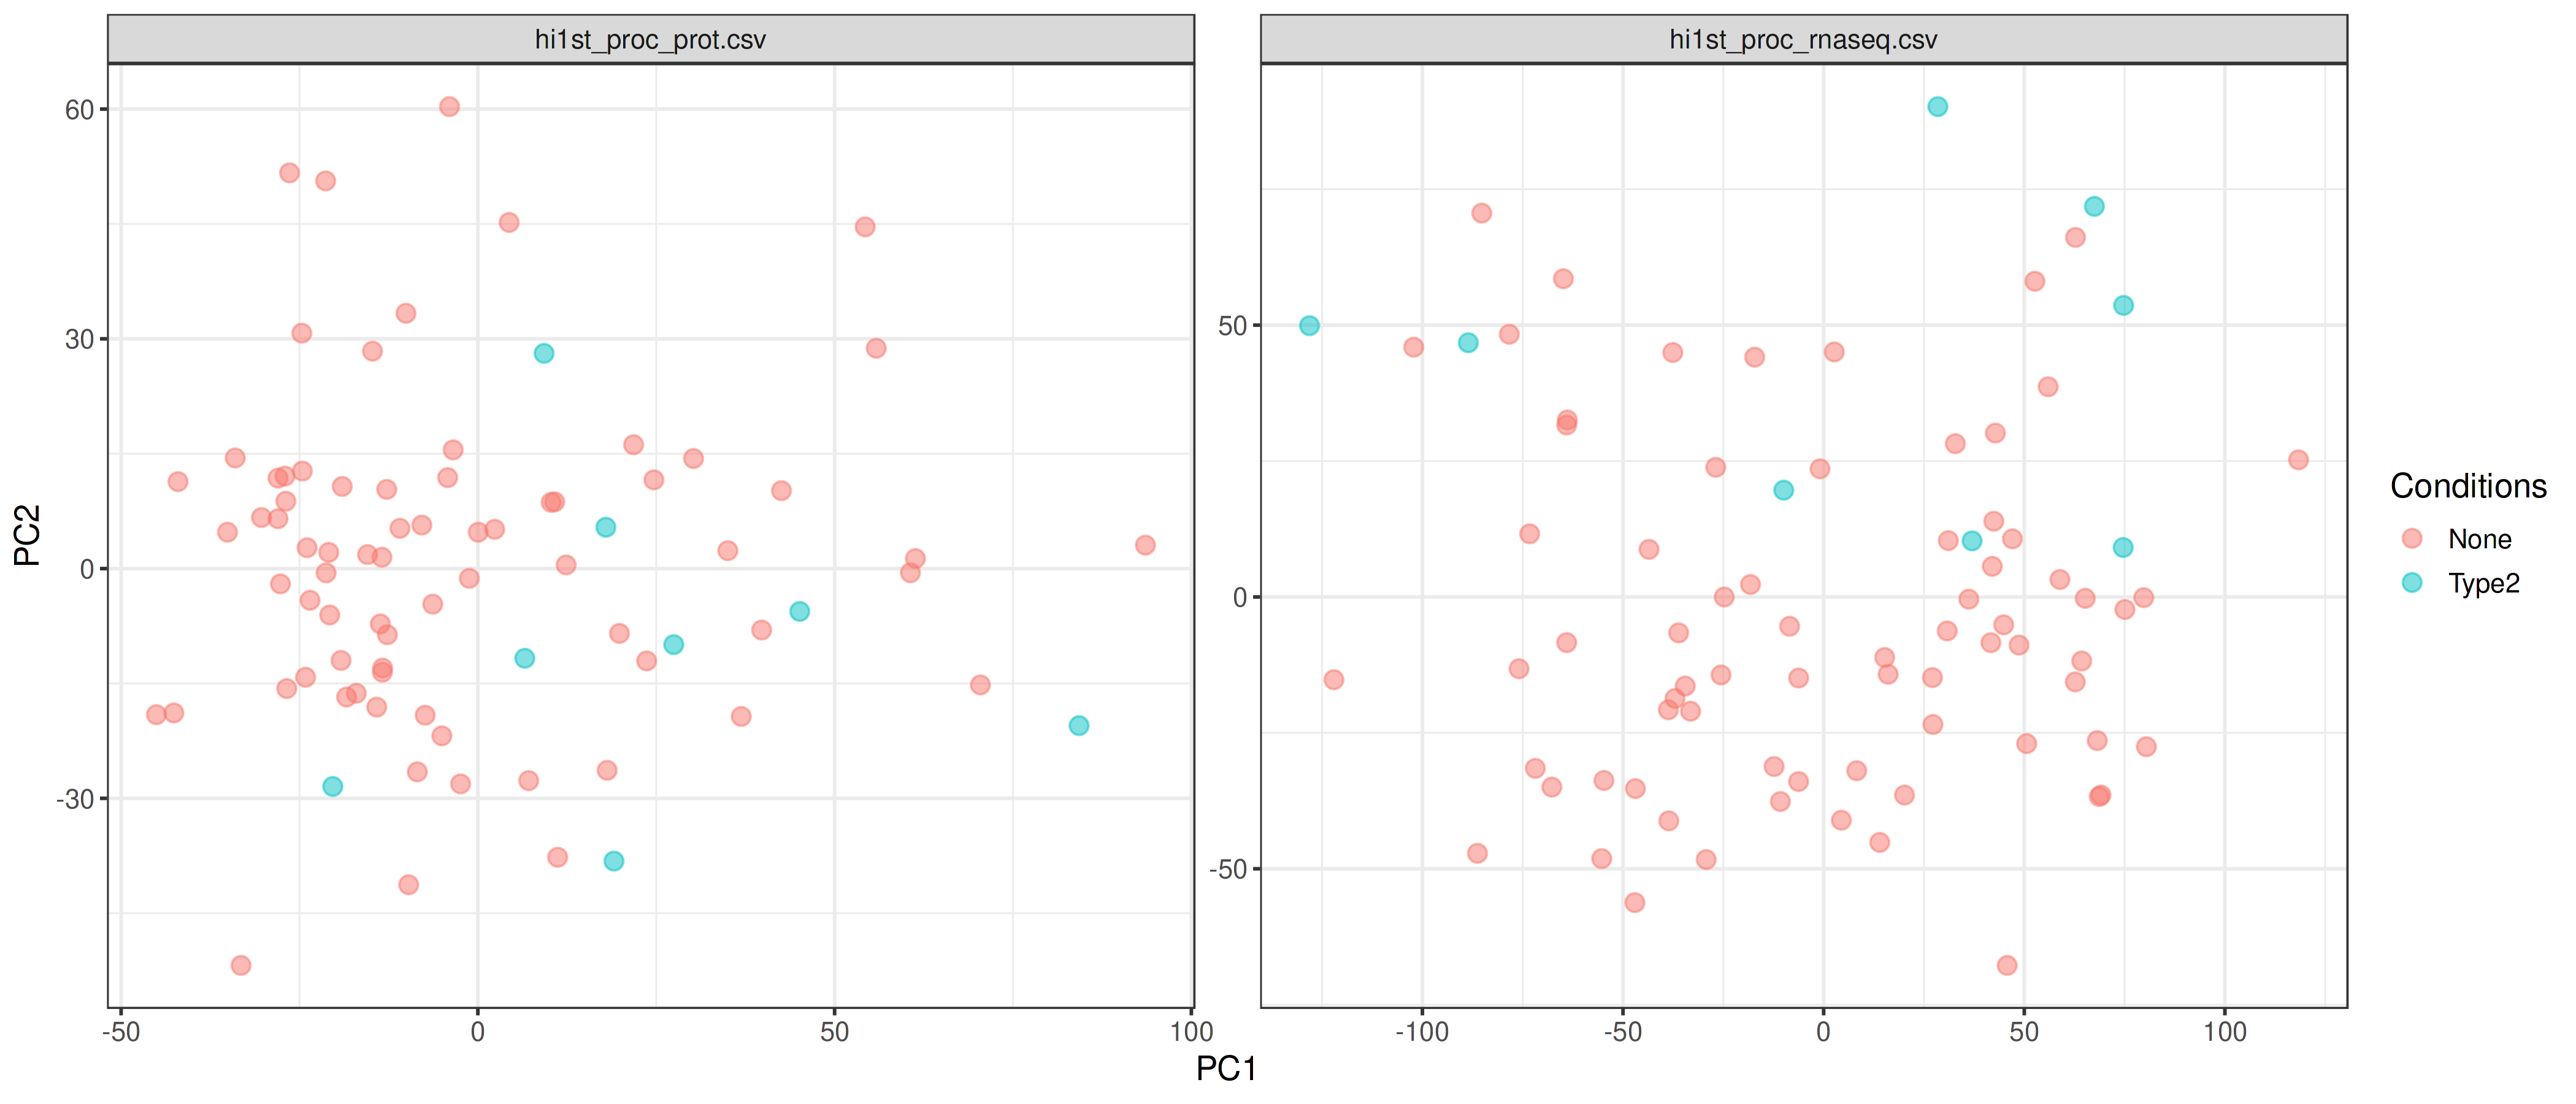
PCA Plot
PCA plots are generated separately for each omics data to show patterns within each layer. Use these to visually check for:
- Sample clustering by biological condition (expected)
- Batch effects (samples cluster by batch instead of condition)
- Outlier samples (samples far from others)
5. Next Steps
After completing data harmonization, click "Proceed" to continue to Statistical Integration for single-omics characterization, pairwise omics analysis, and multi-omics integration methods.
